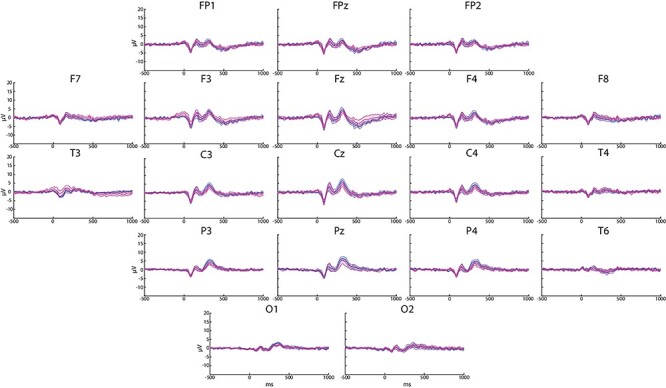
Figure 3 .

Grand average (n = 7) of ERP responses to rare stimuli for the TNS group recorded at all the electrodes. The blue and the magenta lines represent the pre- and the poststimulation waveforms, respectively. The shadowed regions around the traces correspond to SE values.
