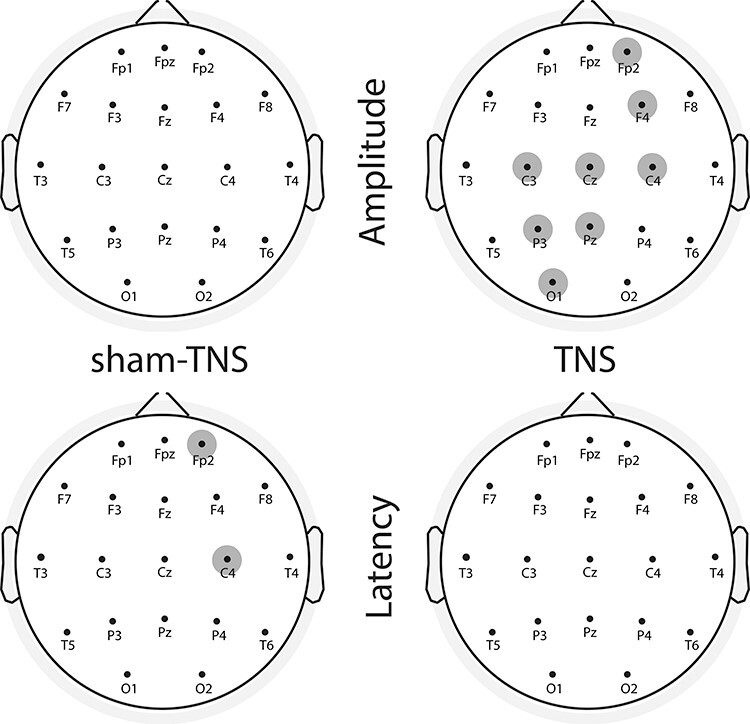
Figure 4 .

Results of the statistical analysis for the P300 component in sham-TNS/TNS groups. The electrodes showing significant differences (in amplitude or in latency) between pre- and post-stimulation are indicated by the highlighted electrodes.

Results of the statistical analysis for the P300 component in sham-TNS/TNS groups. The electrodes showing significant differences (in amplitude or in latency) between pre- and post-stimulation are indicated by the highlighted electrodes.