
Figure 7 .
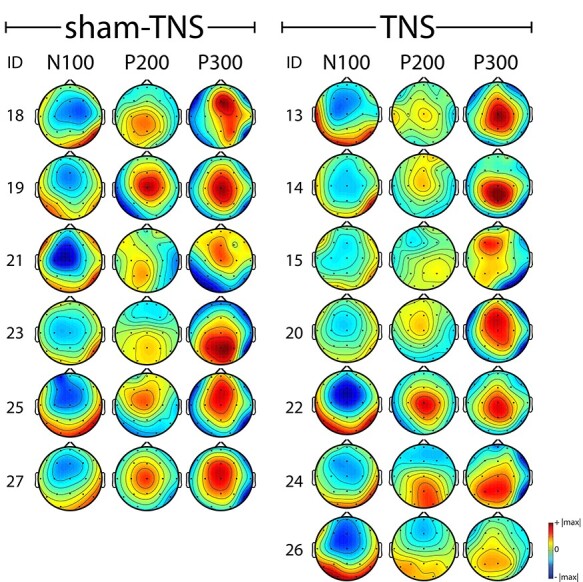
Scalp maps for each and all subjects, belonging to sham-TNS and TNS groups, showing EEG activations at N100, P200, and P300 latency. In both groups, each line corresponds to a single subject. Maps were obtained by averaging pre- and post-TNS-sham/TNS stimulation. In each subject, the range of the color scale was the same in all the scalp maps and corresponded to ±the highest absolute value observed at the 3 time points.