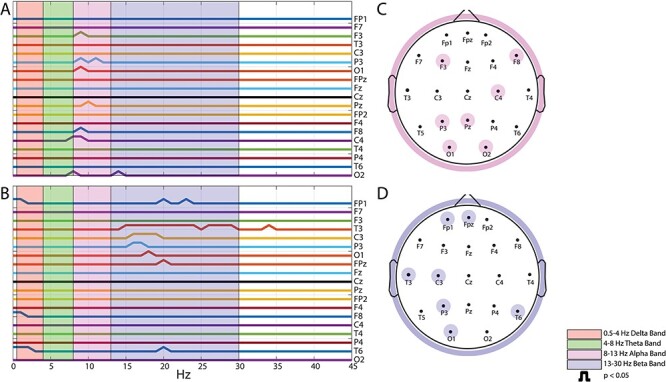
Figure 8 .

Comparison between pre- and poststimulation values of the PSD of rest EEG signal (open-eyes) relative to sham-TNS (A, C) and TNS (B, D). In A and B, each line corresponds to a single electrode. Upper deflections represent points of significant pre-/postdifferences. The highlighted areas in red, green, pink, and blue represent the delta (0.5–4 Hz), theta (4–8 Hz), alpha (8–13 Hz) and beta (13–30 Hz) band, respectively. In C and D, the highlighted electrodes show significant PSD differences in the alpha and in the beta band for the sham-TNS and TNS conditions, respectively.
