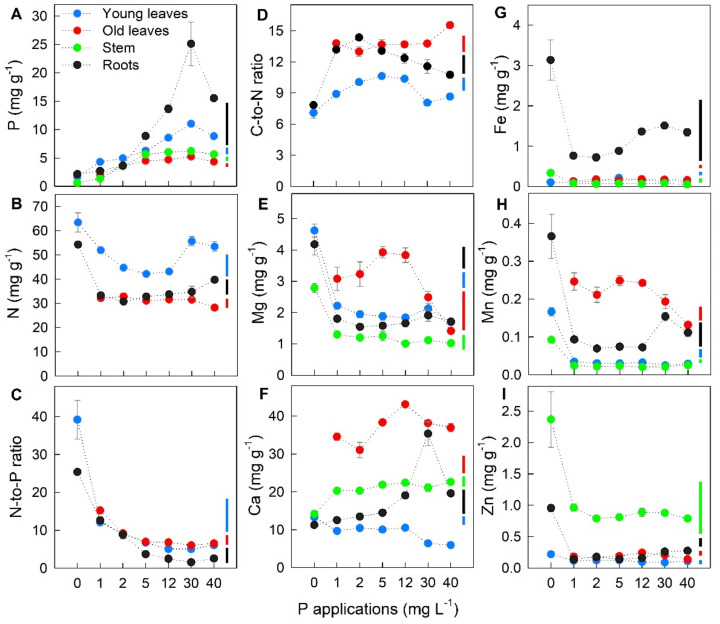
Figure 2.
Effect of different P applications on (A–B,E–I) mineral concentration and (C,D) mineral ratios in young leaves, old leaves, stem, and roots. For all measured traits, P0 data for old leaves are missing due to insufficient sample material for analyses. Error bars indicate standard error of means (n = 4). Vertical bars represent critical value for comparisons among P applications in each plant part by Tukey’s HSD test at p ≤ 0.05.

