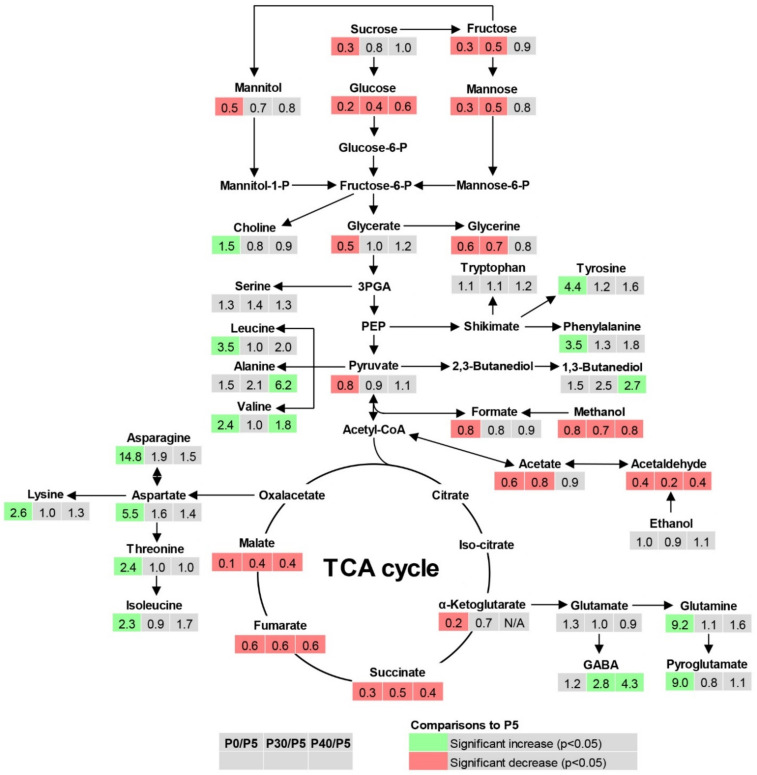
Figure 4.
Effect of P deficiency and toxicity on metabolite concentration in roots of potato plants. The relative ratios were calculated by the division of metabolite concentration plant grown at P0, P30, and P40 with those at P5 as P sufficient treatment (n = 4). Light green and red present the significant increase and decrease (p ≤ 0.05), respectively. N/A = comparison not possible due to incomplete data; 3PGA = 3-phosphoglycerate; PEP = Phosphoenolpyruvate; Acetyl-CoA = Acetyl Coenzyme A; TCA = tricarboxylic acid; GABA = γ-aminobutyrate. Arrows with one direction show synthesis of a metabolite and arrows with double direction show reversible reactions.

