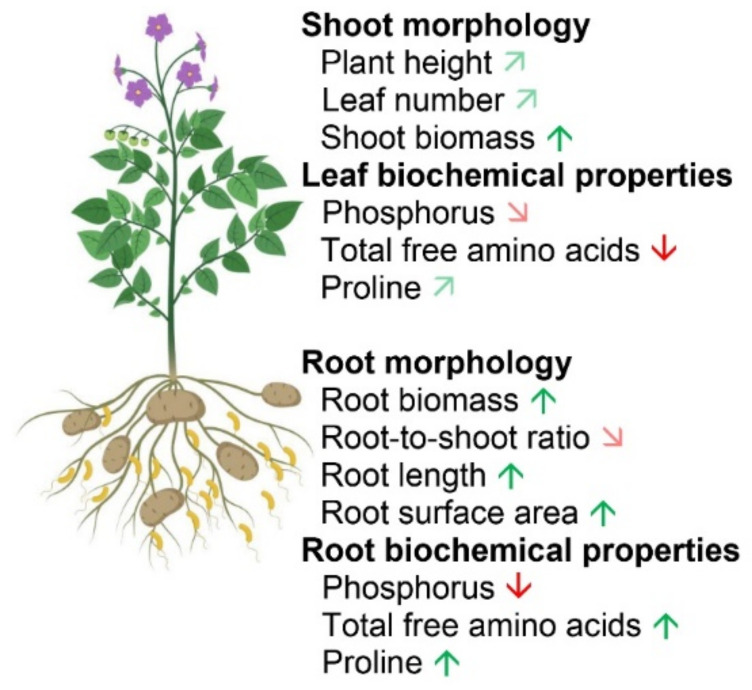
Figure 9.
Summary of the morphological and biochemical responses of the potato plants to PGPR inoculation under P deficiency. Green and red arrows indicate significant increase and decrease (p ≤ 0.05), respectively, compared to optimum P condition. Light green and light red diagonal arrows indicate a tendency of increase and decrease, respectively. Figure 9 was created using BioRender (https://biorender.com, accessed on 14 December 2020) as part of Academic License.

