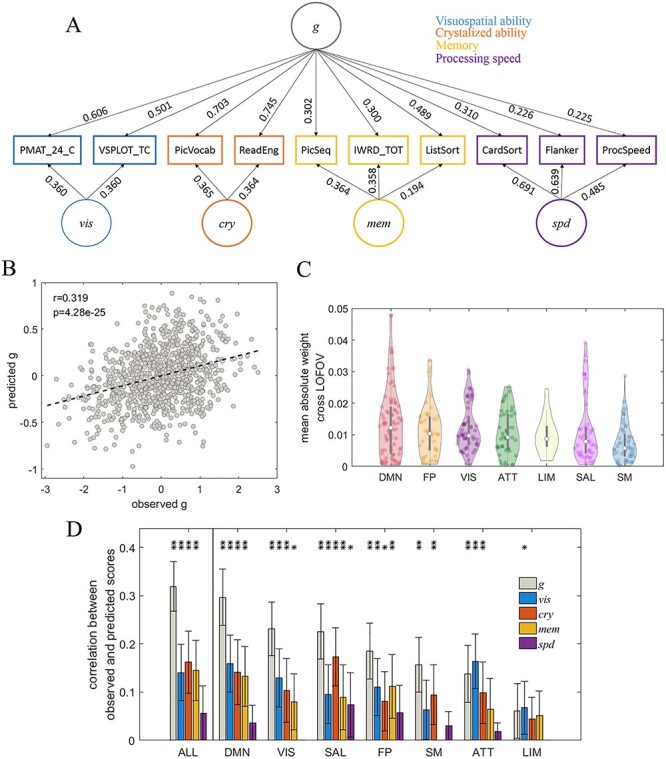
Figure 4 .

Prediction of the facets of cognitive ability using individual cortical entropy profiles. (A) The CFA model used to estimate cognitive ability scores, along with standardized factor loading estimates. (B) A scatter plot of the observed general cognitive ability factor scores g vs. predicted g, based on entropy profiles across the whole cortex. (C) Violin plots of the distributions of averaged absolute regression weights achieved across the LOFOV for each reliable ROI in a given RSN. The RSNs are ranked by medians. (D) A bar plot depicting correlations between the observed and predicted factor scores of different facets of cognitive ability, using ROIs from all networks and each separate RSN as predictors. The RSNs were ranked according to the correlations between the observed and predicted g scores (left to right). (E) The same as (D) but using entropy profile after deleting the unreliable ROIs. * and ** above the bars denote the corresponding significance levels of P < 0.05 and P < 0.01, respectively, after applying the correction of FDR < 0.05. The error bars indicate the 95% CI.
