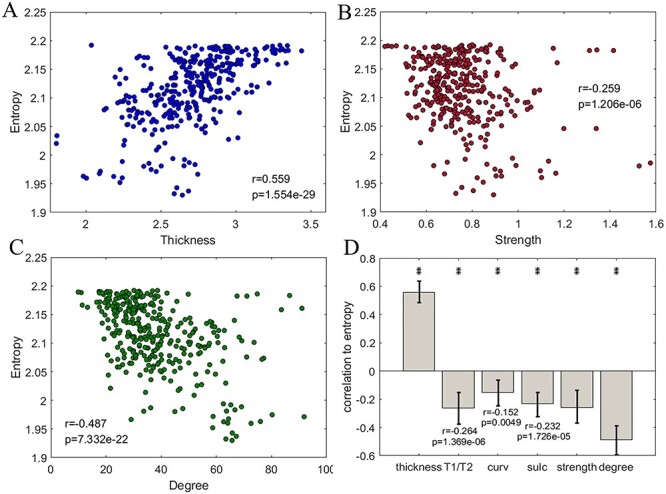
Figure 5 .

The cortical entropy profile as a blueprint and the corresponding structural foundation. (A) A scatter plot of the regional complexity versus the regional cortical thickness value (blueprint). (B) A scatter plot of the complexity blueprint versus the structural connectivity strength blueprint. The structural network data are displayed at a connectivity threshold of  = 0.001. The same threshold was applied to the following subfigures. (C) A scatter plot of the complexity blueprint versus the structural connectivity degree blueprint. (D) A bar plot of the correlations between the complexity blueprint and structural property blueprints. * and ** indicate P < 0.05 and P < 0.01, respectively, after correction at an FDR of < 0.05. The error bars indicate the upper and lower bound of 95% CI.
