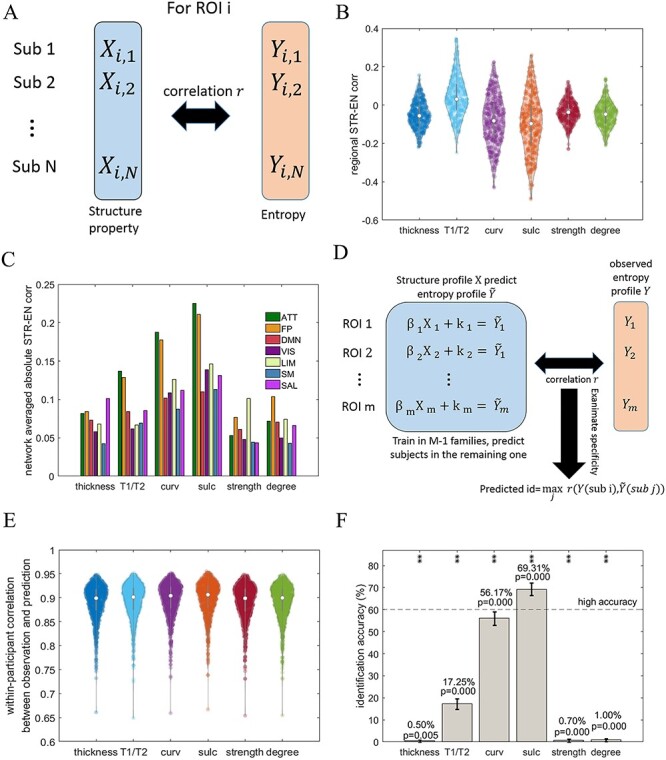
Figure 6 .

The structural basis of the individual entropy profile. (A) A schematic overview of the computation approach used to estimate the association between the brain structure and complexity across individuals in each ROI. (B) The distributions of regional structure–entropy associations across individuals with respect to different structural properties. The network connectivity (strength and degree) results are illustrated using a connectivity threshold of  = 0.001. The same threshold was applied in the following panels. (C) A bar plot of the network-averaged regional structure–entropy correlations derived using different structural properties. (D) The model used to predict cortical entropy profiles using individual structural properties, together with the examination of specificity across individuals. (E) Violin plots depicting the correlations between the observed and predicted entropy profiles for the same participant according to different structural properties. (F) The accuracies of identification based on observed and predicted individual cortical entropy profiles when using different structural properties. * and ** above the bars denote the corresponding significance levels of P < 0.05 and P < 0.01 obtained by the permutation test, respectively, after applying the correction of FDR < 0.05. The error bars indicate the 95% CI.
