
Figure 2 .
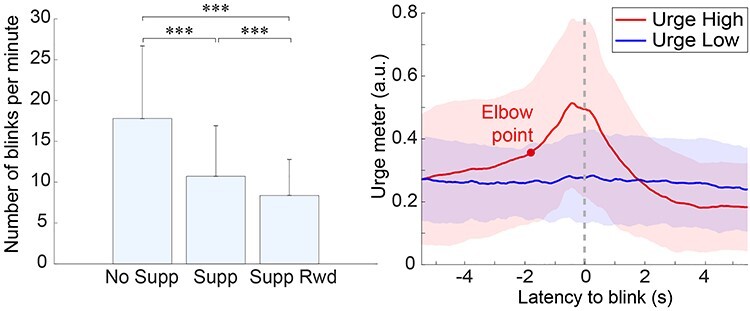
Left, the group-mean number of blink counts for the condition Suppression. The error bar represents 1 SD. ***P < 0.001 (Bonferroni-corrected). Right, average time-course of urge input obtained from trials separated into Urge High and Low. The trials were separated into the 2 groups according to the single-trial urge time-series correlation with that of the within-subject mean. The red dot on the Urge High plot around −1.812 s point shows the optimum bisection point that separates the rise of the plot into 2 parts. The color shades in the plot indicate ±1 SD.