
Figure 3 .
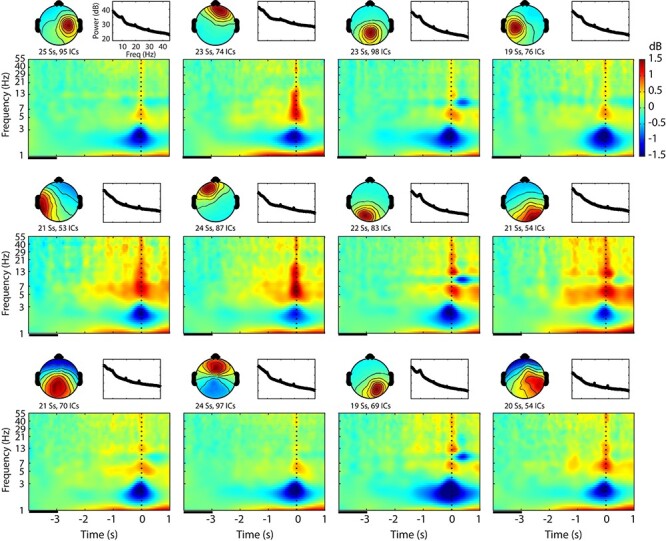
Cluster-mean scalp topography, power spectral density, and event-related spectral perturbation (ERSP) for each of the 12 clusters determined by Silhouette analysis and averaged across all the conditions. This figure shows a general outline of the whole-brain data right after group-level independent component (IC) clustering. The graph scales are identical across the clusters. In the time–frequency plots, baseline period is indicated as a black line between −4 and −3 s relative to blink onset. Ss, subjects; ICs, independent components.