
Figure 6 .
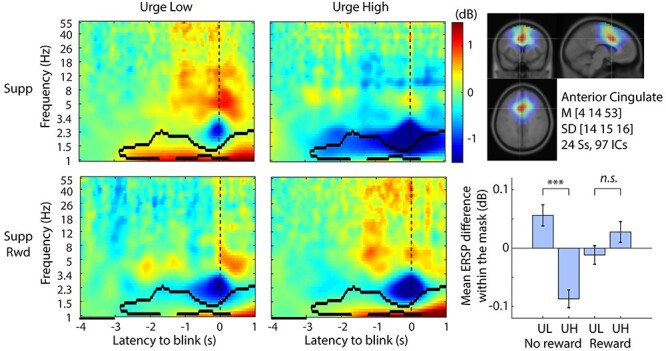
Event-related spectral perturbation (ERSP) plots for interaction Urge and Reward in the anterior cingulate independent component (IC) cluster. The contour mask in the time–frequency plots indicates P < 0.001 after controlling weak family-wise error rate (wFWER). Left 2 columns indicate ERSPs for the 2 × 2 conditions. Baseline period is indicated as a black line between −4 and −3 s relative to blink onset. Bottom left, cluster-mean IC scalp topography. Top right, cluster-mean dipole density with FWHM = 20 mm and the centroid coordinate in the MNI template head. Bottom right, the mean ERSP values with SE within the significance mask compared across conditions. ***P < 0.001. UL, Urge Low; UH, Urge High.