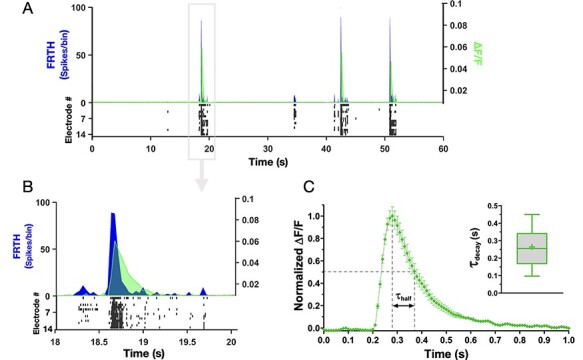
Figure 3 .

Synaptic glutamate level rises and falls during SBs. Simultaneous recording of neuronal activities with MEA and synaptic glutamate dynamics detected by astrocytes with iGluSnFr imaging is shown here. (A) Top panel shows summed neuronal spiking activities as FRTH (with bin size 40 ms, black trace) overlapped with glutamate dynamics detected simultaneously through iGluSnFr imaging. Change in fluorescence is plotted as ∆F/F (gray trace). Bottom raster plot (black) shows detected neuronal activities from individual electrodes. (B) shows enlarged view of one of the SB events in A. Note that synaptic glutamate level increases globally and decays rapidly during and after SB events. (C) Shows average normalized fluorescence ∆F/F from a sample network. The time taken for decrease of synaptic glutamate level from its maximum to half during SB is denoted by τhalf. Inset shows summary of glutamate decay time (τdecay) in cultured cortical networks, calculated as τhalf/ln2. Middle line in the box plot shows median and cross represents mean (0.26 ± 0.11 s, n = 8 cultures).
