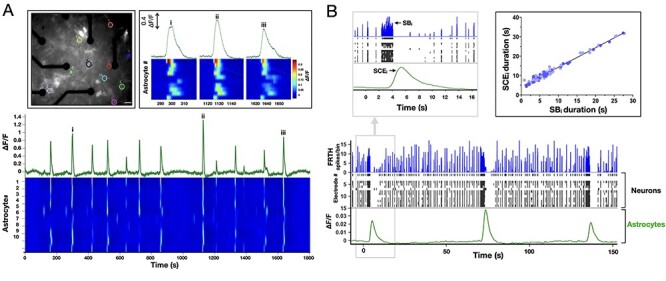
Figure 5 .

Astrocytes exhibit synchronous calcium dynamics following SBs. Top inset on left shows fluorescence micrograph of a culture expressed with cyto-GCaMP6f calcium sensors in astrocytes, scale bar = 30 μm. Different colored circles indicate locations of 10 randomly selected and spatially distant calcium-active astrocytes. Traces in green show summed fluorescence intensity–time plot of the selected astrocytes. Heatmap shows corresponding temporal dynamics of calcium intensity in individual astrocytes. Top right inset shows enlarged view of 3 SCE events marked as (i, ii, iii). Note that the activation pattern remains similar in each event, indicating a hierarchical order of astrocyte activation during SCEs. (B) Shows temporally aligned activities of neurons obtained from MEA (FRTH with 40-ms bin size, blue trace) and corresponding raster plot (black trace), with collective calcium activities in astrocytes. Top left inset shows enlarged view of a global event when an astrocytic SCE appears when a long persisting neuronal SB occurs. Note that all neuronal activities ceased during the global calcium rise in astrocytes. Neuronal activity reappeared soon after the SCE decay. Top right inset shows duration of SCE was found to be linearly related to its preceding SB duration (n = 87, 4 cultures).
