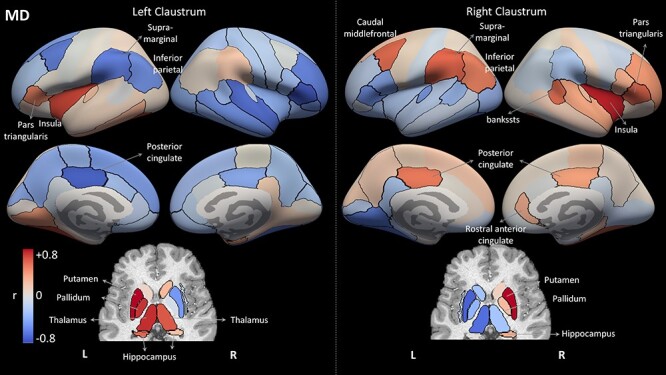
Figure 10 .

Structural correlation results for region MD values. Each region is color-coded according to its correlation with the left or right claustrum in terms of MD values, similar to Figure 8. Compared with the volume analysis (Fig. 8), the MD network is less symmetrical, and the MD values of bilateral claustra are not correlated with each other across subjects.
