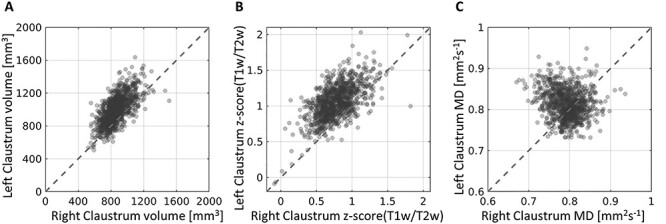
Figure 7 .

Claustrum characteristics. The left claustrum’s properties are plotted as a function of the right claustrum for all subjects. The volume (A) and the z-scored values of the T1w/T2w ratio (B) show high agreement between the left and right claustra, with the left claustrum showing higher values in both. The MD values (C) do not show a consistent difference between the left and right claustra across subjects. The mean values can be seen in Table 2.
