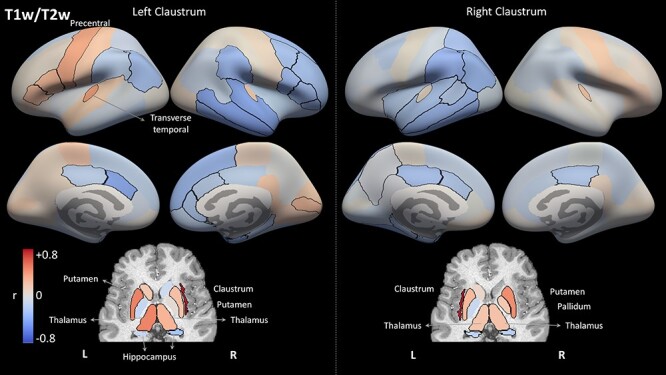
Figure 8 .

Structural correlation results for region volume. Each region is color-coded according to its correlation with the left or right claustrum in terms of volume. Regions with significant correlation (p <0.01, corrected for multiple comparisons of 2 hemispheres × 74 regions × 3 measures) are outlined in black. Note the overall symmetry between hemispheres, as well as between the results for the 2 claustra. Cortical regions are presented on FreeSurfer's inflated average cortical surface (top), whereas the subcortical regions are presented in an axial view (bottom). Key: L: left; R: right; r: Pearson's correlation coefficient.
