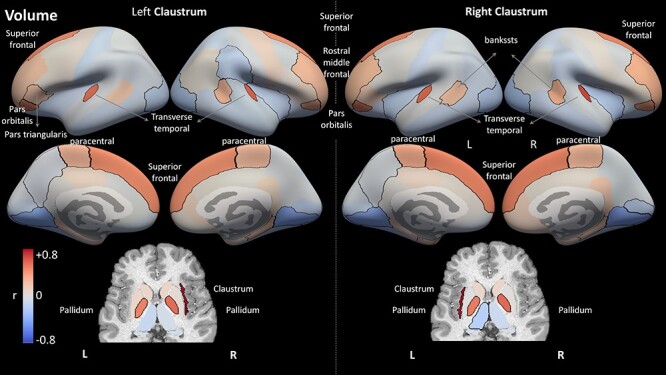
Figure 9 .

Structural correlation results for region T1w/T2w values. Each region is color-coded according to its correlation with the left or right claustrum in terms of standardized T1w/T2w values, similar to Figure 8. Compared with the results for volume (Fig. 8), the covariance network is less symmetrical, and consists of more negative correlations.
