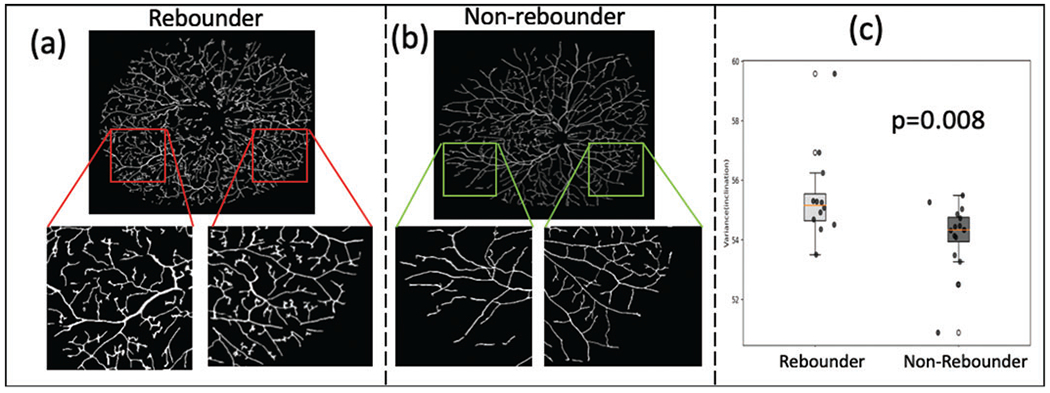
Figure 3.

Tortuosity assessment. (A) and (B) show the vessel network on example baseline FA images of a rebounder and a non-rebounder, respectively. Insets show a zoomed representation of the regional vasculature. The images represent the extracted vascular network using computerised segmentation (rather than the entire vascular system on the UWFA). As may be observed, the vessels are more tortuous in the rebounder as compared with the non-rebounder. This is quantitatively reflected in the box and whisker plot in (C). The box plot in red corresponds to the variance of vessel inclination values from the rebounders, and the one in green corresponds to the variance of inclination values from the non-rebounders. FA, fluorescein angiography; UWFA, ultra-widefield fluorescein angiography.
