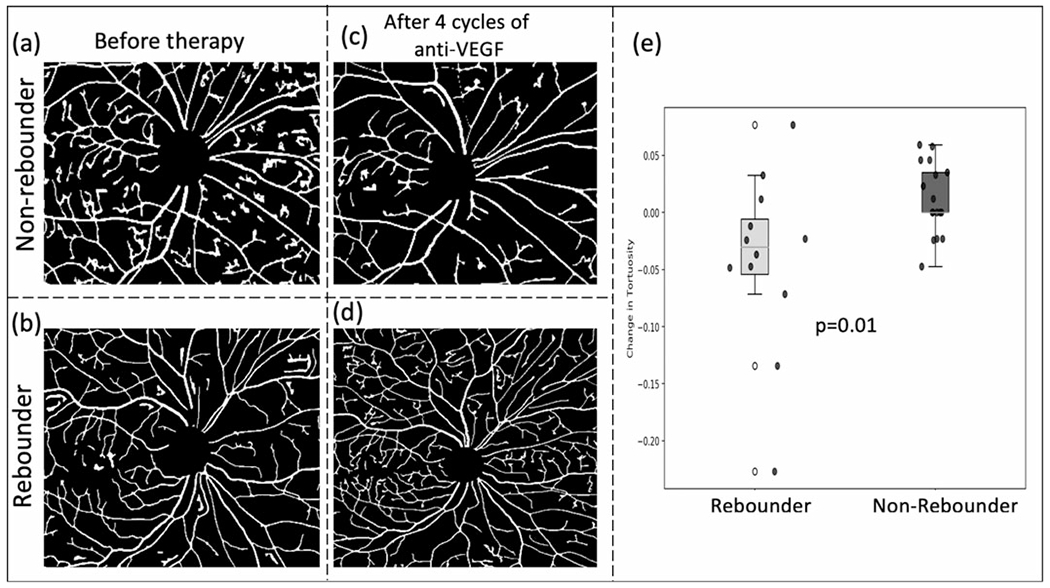
Figure 4.

Vascular tortuosity change following therapy. (A) and (B) show the vasculature around the macula before initiation of anti-VEGF for a subsequent non-rebounder and a rebounder, respectively. After four cycles of therapy, the vasculature in the same region is shown in (C) and (D). Box and whisker plots of the best performing two delta tortuosity features (M4-M1) are shown in (E). VEGF, vascular endothelial growth factor.
