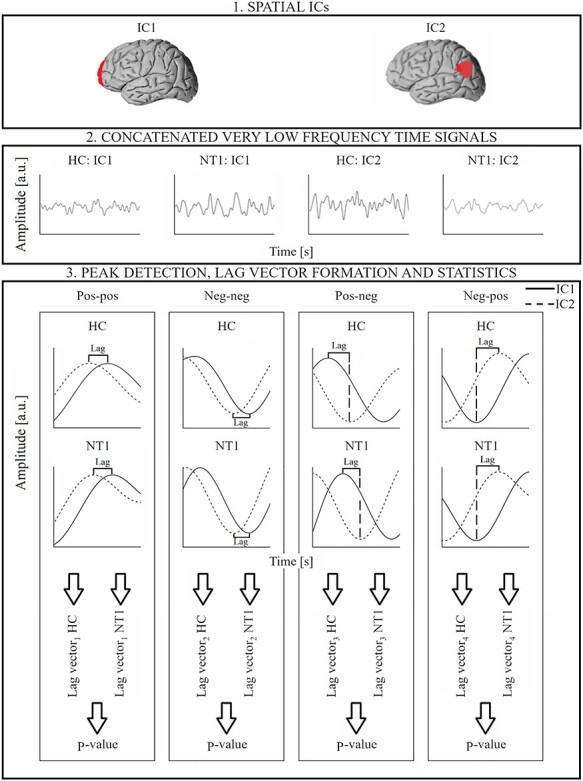
Figure 1 .

General workflow for DLA approach. (1) A given pair of RSN is selected. (2) Corresponding concatenated band-pass filtered (0.01–0.1 Hz) and detrended 10 min time signals for HC and NT1 groups. (3) For each of the 4 analysis (pos-pos, neg-neg, pos-neg, neg-pos), the lag values between the ICs are calculated, peak-by-peak, and separately for both groups. The corresponding P-value (for the given RSN pair) is calculated between the 2 lag vectors (HC and NT1).
