Figure 4 .

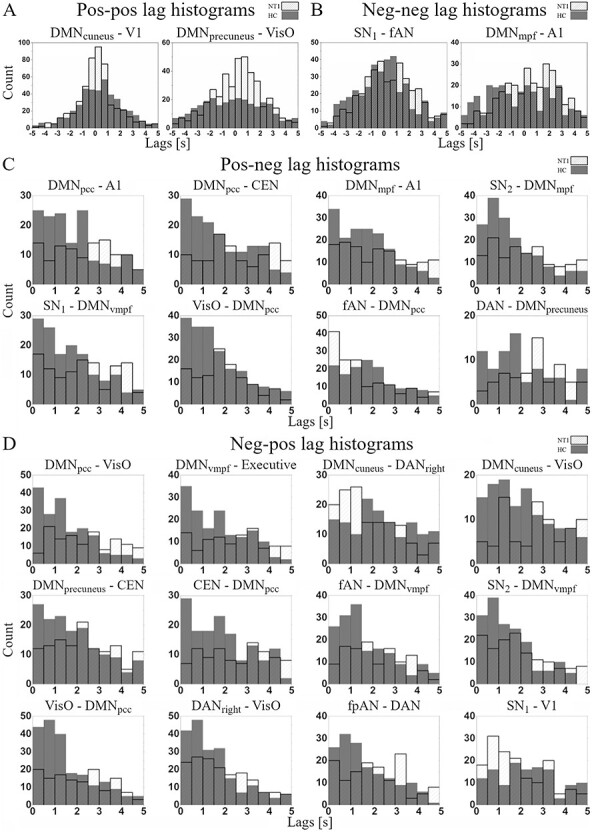
Lag value histograms of same phased (A) pos-pos, (B) neg-neg and anticorrelated (C) pos-neg, (D) neg-pos significant (P < 0.005) RSN pairs. HC group’s lag values are shown in dark gray and NT1 group’s lag values in white bins.

Lag value histograms of same phased (A) pos-pos, (B) neg-neg and anticorrelated (C) pos-neg, (D) neg-pos significant (P < 0.005) RSN pairs. HC group’s lag values are shown in dark gray and NT1 group’s lag values in white bins.