. 2021 Mar 29;12(20):6913–6922. doi: 10.1039/d0sc06561g

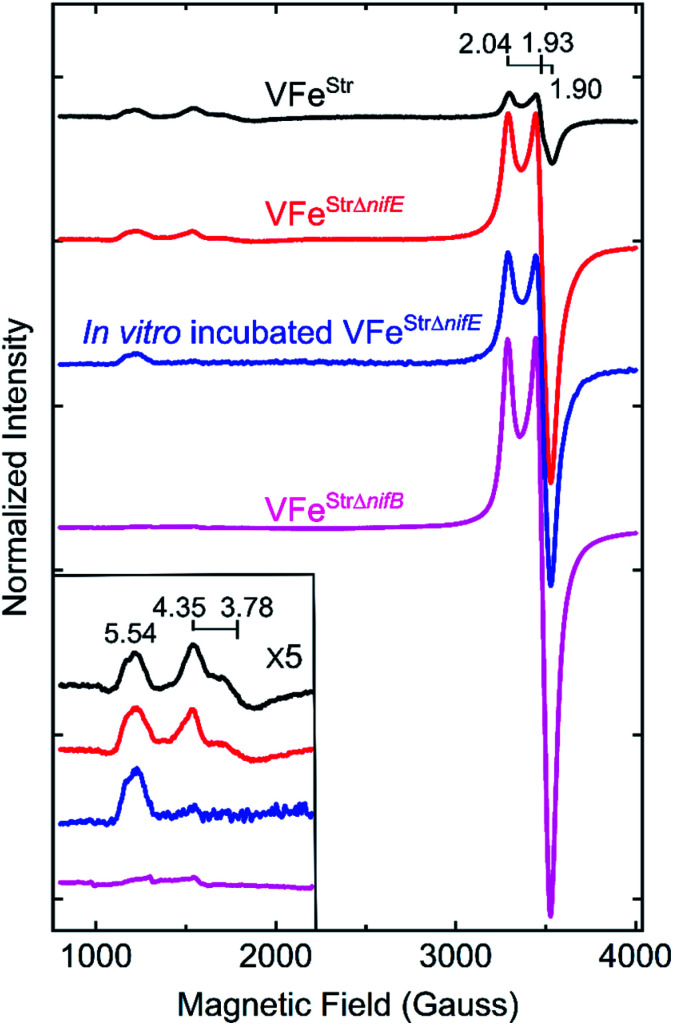
Fig. 3. X-band EPR spectra of resting state strep-tagged VFe proteins. The EPR spectra for 50 μM of VFeStr protein (VFeStr, black trace), for 52 μM of VFeStr protein from a nifE-deleted genetic background (VFeStrΔnifE, red trace), for 48 μM of in vitro incubated Strep-tagged VFe protein from an nifE-deleted genetic background (in vitro incubated VFeStrΔnifE, blue trace), and for 50 μM VFeStr protein from an nifB-deleted genetic background (VFeStrΔnifB, magenta trace) are presented. The details for creation of the different strains with different genotypes and the in vitro incubation experiment are found in the ESI. All samples were made in a 100 mM MOPS buffer, pH 7.3, with ca. 20 mM sodium dithionite and 150 mM NaCl. Inset shows an expansion of the low field region. EPR conditions: temperature, 12 K; microwave frequency, 9.38 GHz; microwave power, 20 mW; modulation amplitude, 8.14 G; time constant 20.48 ms. Each trace is the sum of five scans.

Fig. 3