. 2021 Mar 29;12(20):6913–6922. doi: 10.1039/d0sc06561g

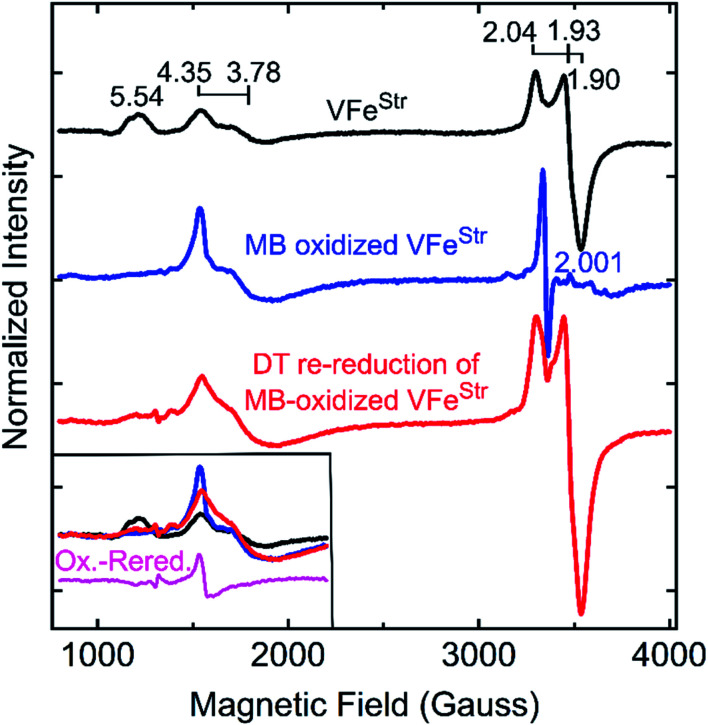
Fig. 4. X-band EPR spectra of oxidized VFe proteins. Shown is the resting state VFeStr in MOPS buffer with 20 mM DT (black trace), methylene blue (MB)-oxidized VFeStr after 15 min incubation at room temperature in MOPS buffer without DT (blue trace), and 20 mM DT re-reduced VFeStr after being oxidized by MB for 15 min (red trace). The MOPS buffer was 100 mM, pH 7.3, with ca. 150 mM NaCl. The final VFeStr concentration was 50 μM in all samples. The inset in the left bottom corner presents an overlay of the low field region of the spectra from three spectra and the spectra difference (magenta trace) between the MB-oxidized sample and DT re-reduced sample after MB oxidation. EPR conditions are the same as those in Fig. 3.

Fig. 4