. 2021 Mar 29;12(20):6913–6922. doi: 10.1039/d0sc06561g

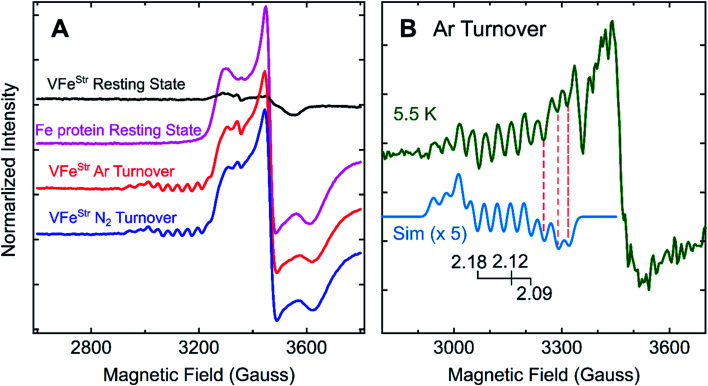
Fig. 5. g-2 region X-band EPR spectra of V-nitrogenase proteins. (A) 12 K spectra of resting states (black trace for VFeStr and magenta trace for Fe protein) and Fe protein-VFeStr freeze-trapped during turnover under Ar (red trace) and N2 (blue trace) (B) 5.5 K (green trace) spectra of Ar-turnover Fe protein–VFeStr along with simulation of turnover intermediate (cyan trace) with 51V hyperfine coupling, aiso = 110 MHz, g = [2.18, 2.12, 2.09], and isotropic EPR linewidth of 75 MHz. Samples: all samples contain 5 μM of VFeStr protein except the Fe protein resting state sample, and 40 μM of Fe protein except the VFeStr resting state sample. All samples made in buffer with 200 mM MOPS at pH 7.3 and an ATP-regeneration system (20 mM ATP, 20 mM MgCl2, 1 mg mL−1 BSA, and 0.4 mg mL−1 creatine phosphokinase) with a final dithionite concentration at ∼20 mM. EPR conditions: as in Fig. 3 except each spectrum is the sum of 10 scans.

Fig. 5