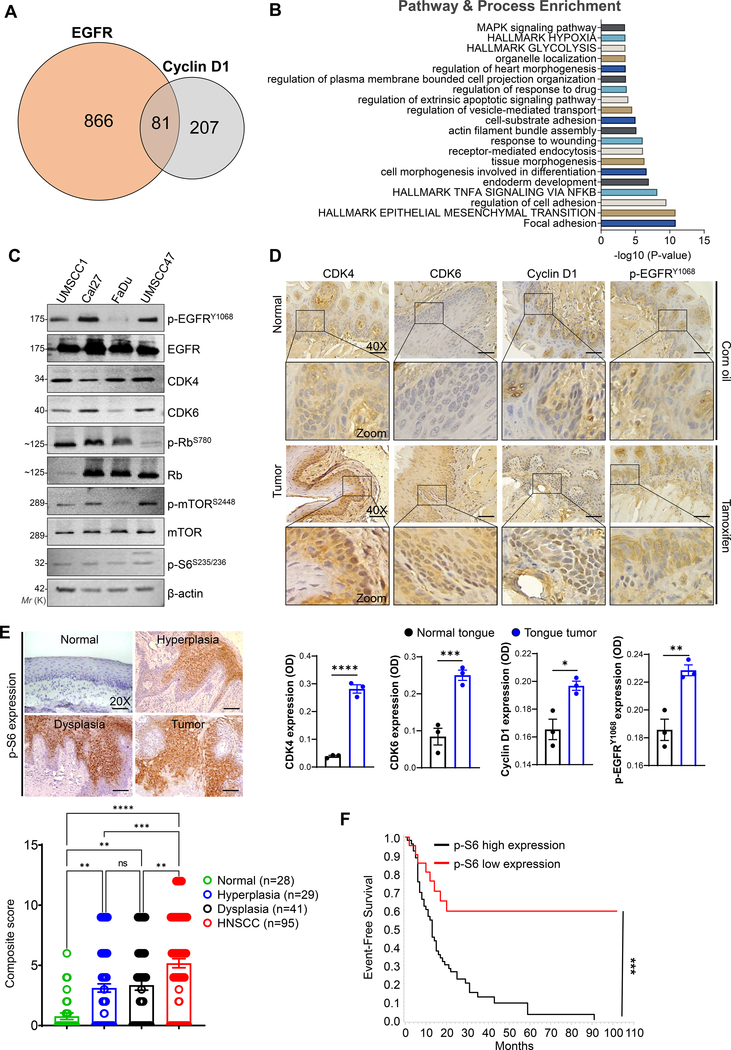
Fig. 1. Hyperactivation of EGFR and cyclin D1-CDK4/6 signaling in HNSCC.
a. Venn diagram showing co-expressed genes with EGFR (947 genes) and cyclin D1 (288 genes) in TCGA HNSCC patients extracted from the cBioPortal (https://www.cbioportal.org/). Eighty-one genes are common across the two gene sets. b. Gene set enrichment analysis (https://metascape.org/gp/) based on pathway and processes indicate the gene clusters associated with EGFR and cyclin D1 in regulating the hallmarks of glycolysis, epithelial to mesenchymal transition, and cell growth, etc., c. Western blot analysis of EGFR and CDK4/6 signaling proteins in whole cell lysates (20–40 μg) loaded in 8–12 % SDS-PAGE. β-actin used as a loading control. d. Immunohistochemistry in normal (corn oil injected) and tumor tissues (tamoxifen injected) obtained from the genetically engineered mice model (K14-CreERtam;LSL-KrasG12D;Trp53R172H). Representative immunohistochemistry images were photographed by Leica ICC50E (40X). p-EGFR (Tyr-1068), cyclin D1, CDK4, and CDK6 was analyzed in the tissues (n=3) using ImageJ (IHC Profiler plugin) [22]. The quantification of positive staining (OD) of the respective proteins are provided (bottom panel). Optical density (OD) = log (max density/mean intensity). e, f. Representative immunohistochemistry images of p-S6 (Ser-235/236) analyzed in normal (n=28), leukoplakia (n=70) [hyperplasia (n=29), dysplasia (n=41)], and HNSCC (n=95)]. Staining represented as a composite score [intensity score × percentage positive cells]. Event-free survival of HNSCC patients based on p-S6 expression. Data represent mean ± SEM. Unpaired two-tailed t-test (d & f) and Ordinary one-way ANOVA with Tukey’s multiple comparisons test (e). **P < 0.01, ***P < 0.001, ****P < 0.0001, and ns=non-significant.

