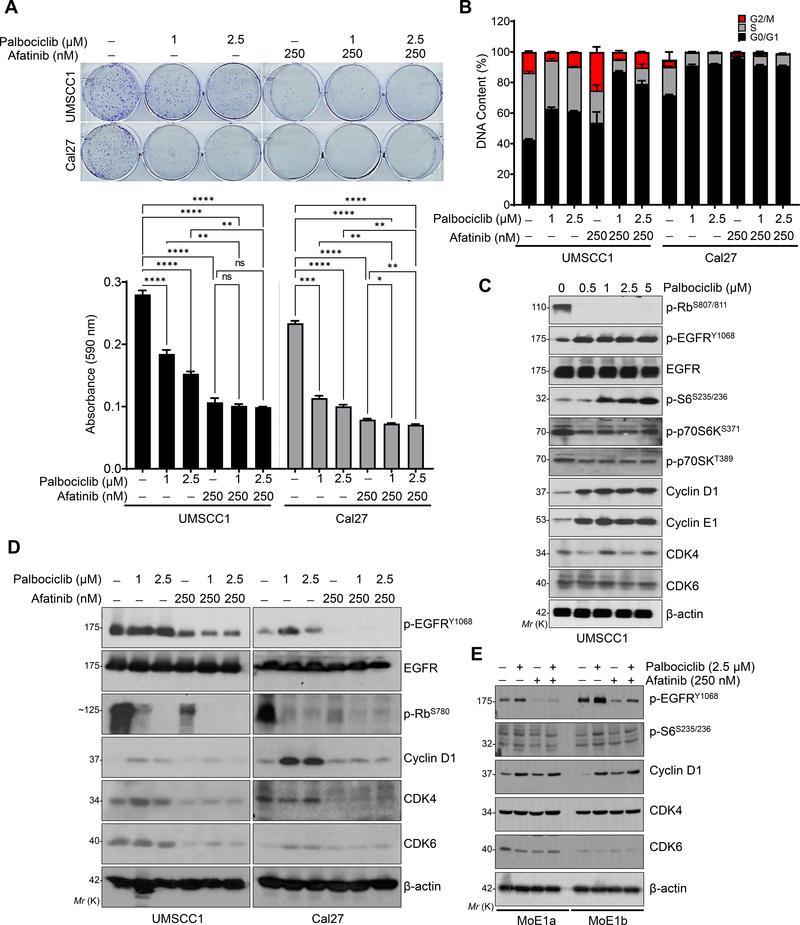
Fig. 2. Afatinib and palbociclib in-combination decrease the proliferation of HNSCC cells by inducing cell cycle arrest.
a. Representative images of colony formation assay after 15–21 days of treatments with palbociclib (1 and 2.5 μM), afatinib (250 nM) or combination (palbociclib- 1 & 2.5 μM and afatinib- 250 nM) in UMSCC1 and Cal27 cell lines. Quantification was performed (absorbance at 590 nm) after dissolving the colonies (0.5% crystal violet staining) with 10% acetic acid and represented as bar diagram (bottom panel). b. Distribution of DNA content (in percentage) by Flow cytometry analysis (UMSCC1 and Cal27) after palbociclib (1 and 2.5 μM), afatinib (250 nM) and combination treatments for 48 h. c. Western blot of p-Rb (Ser-807/811), p-EGFR (Tyr-1068), p-S6 (Ser-235/236) and cyclin D1 in the whole cell lysates after dose-dependent treatment with palbociclib (0.5 μM to 5 μM) for 48 h. d. Western blot in whole cell lysates after various treatments [palbociclib (1 & 2.5 μM), afatinib (250nM) and combination (palbociclib- 1 & 2.5 μM and afatinib- 250 nM) for 48 h in UMSCC1 and Cal27. Combination treatment affects p-EGFR (Tyr-1068), p-S6 (Ser-235/236), cyclin D1, CDK4, and CDK6 expression. e. Western blot after treatments as described (d), after 48 h treatment in the immortalized normal oral epithelial cell lines, MoE1a and MoE1b. β-actin as a loading control. Data represent mean ± SEM (n=3). One-way ANOVA and Tukey’s multiple comparisons test (a). *P < 0.05, **P < 0.01, ***P < 0.001, ****P < 0.0001, and ns=non-significant.

