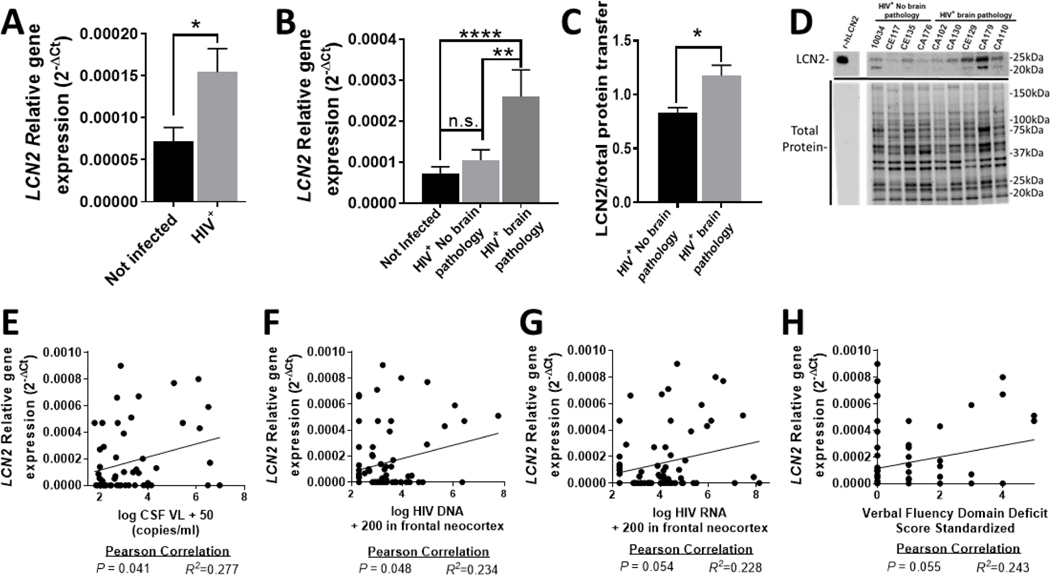
Fig. 1. LCN2 levels are increased in brains of individuals with HIV neuropathology.
(A-B) Relative gene expression levels of LCN2 were assessed using mRNA from the middle frontal gyrus (neocortex) of 72 HIV+ and 56 non-infected patients. (B) Patients were then separated based on the presence or absence of histological signs of HIV brain pathology (Gelman et al., 2013) and levels of LCN2 mRNA were compared (HIV+ No brain pathology, n = 49; HIV+ brain pathology, n = 23). (C-D) Frontal gyrus protein of a subset of infected patients was analyzed using Western blotting (HIV+ No brain pathology, n = 4, and HIV+ with brain pathology, n = 5). (E-H) Pearson correlation was calculated for the patients’ virological parameters (Gelman et al., 2013) and their corresponding LCN2 levels. Values in graphs are mean ± s.e.m.; * P ≤ 0.05, ** P ≤ 0.01, *** P ≤ 0.001, **** P ≤ 0.0001, ANOVA followed by Fisher’s PLSD post hoc test (B) or Student’s t test (A, C).

