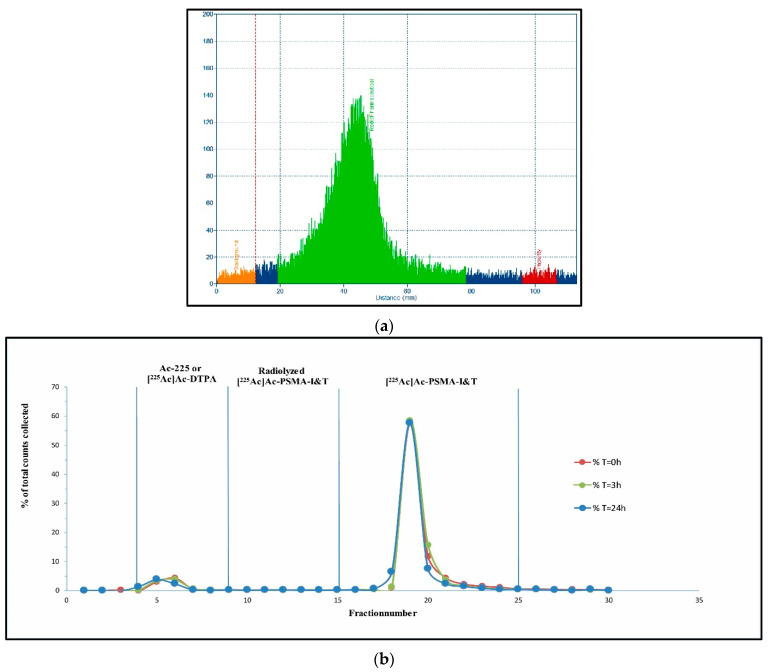
Figure 5.
Quality control results for optimal labeling conditions. Radio-(i)TLC (x-axis distance (mm), y-axis cps, measured from bottom to top, radiopharmaceutical (green), impurity (red), background (orange), non-selected area (blue)) (a) and HPLC chromatogram presenting stability (x-axis represents fraction number, y-axis % of total counts) in time, measured for 0, 3, and 24 h. RCY of >95% and RCP of >90% were maintained up to 3 h (b).

