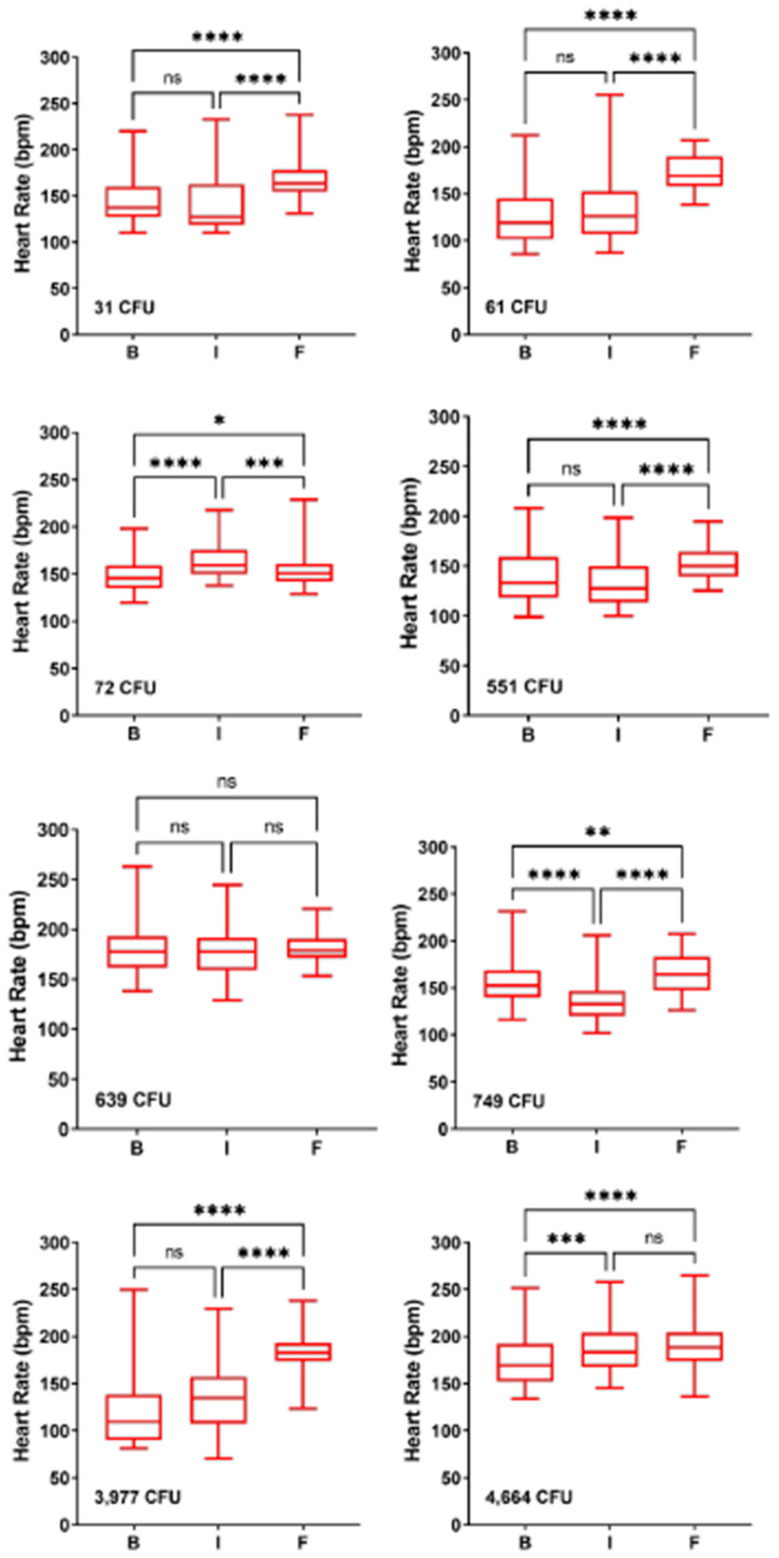
Figure 3.
Mild elevation in heart rate during the febrile period. Data is shown from eight individual macaques across all dose ranges; values plotted are the median with the standard deviation and range for each period. Challenge doses are shown for each macaque. Significant changes from baseline were determined by Brown–Forsythe’s analysis of variance (ANOVA). n.s. = not significant, * = p < 0.05, ** p < 0.01, *** p < 0.001, **** p < 0.0001.

