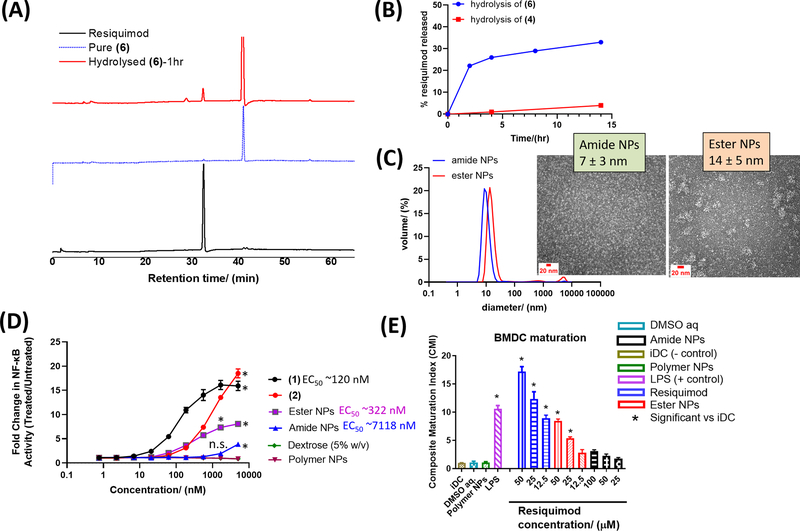
Figure 1.
HPLC chromatograms showing hydrolysis of (6) in PBS at 37 °C leads to ‘release’ of resiquimod (A). Calculated amount of resiquimod released via hydrolysis of (6) and (4) in PBS at 37 °C over time (B). Dynamic light scattering (DLS) measured sizes of amide NPs (10 ± 0.3 nm) and ester NPs (15 ± 0.9 nm) formulated from (8) and (9), respectively. For DLS, N=5 measurements and for TEM, the average diameter and standard deviation were calculated based on at least 50 NPs from different parts of the grid. TEM images showing the morphology of the NPs are inserted (C) (larger TEM images are available in supporting information, Figure S5). NP immune activity in vitro was determined (i) using RAW Blue cells by looking at the NF-KB activity measured via secreted embryonic alkaline phosphatase (SEAP) assay (N=3) (D), and (ii) by determining the ability of the NPs to cause maturation of BMDCs (N=3) (E). In (D), n.s. = not significant and * represents p < 0.05 compared to the polymer NPs at a specific concentration, as analyzed using ANOVA with a Tukey post hoc test. The EC50 values in (D) were estimated using the dose response (stimulation) fitting in GraphPad. The composite maturation index (CMI) reported in (E) represents an unweighted average of the expression of CD80, CD86, and MHCII normalized to the iDC (untreated) population. iDC: immature DCs; DMSO aq: dimethylsulfoxide in PBS buffer (the resiquimod was dissolved in a small amount of DMSO (<10% v/w) prior to dilution with PBS thus DMSO aq. was a control); LPS: lipopolysaccharide (* represents p < 0.05 compared to the iDC population, as analyzed using ANOVA with a Tukey post hoc test).

