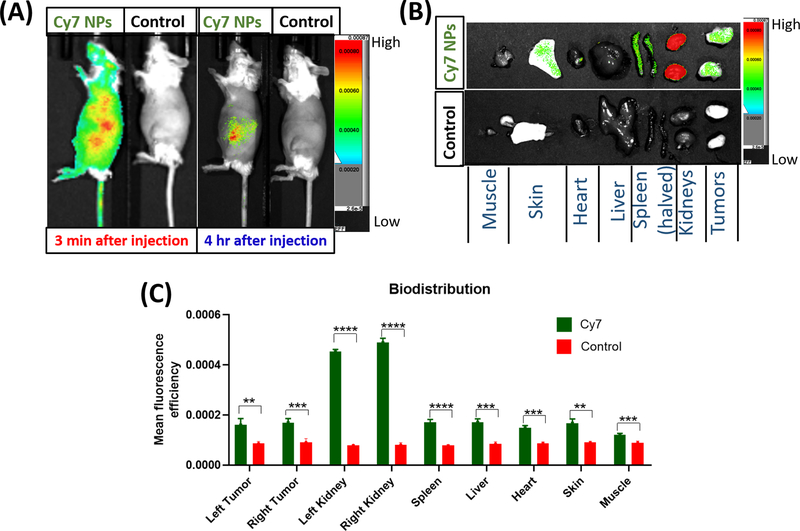
Figure 3.
Biodistribution studies of Cy7-labelled NPs following injection via the mouse tail vein (N=4 each, control (saline) or dye-labeled NPs). Fluorescence images acquired using the SPECTRAL LAGO X, 3 min post injection and 4 hr later (A). Ex-vivo fluorescence images of harvested organs as visualized on the SPECTRAL LAGO X 4 hr post injection (B). Assessment of accumulation of the NPs in different organs through quantification of the fluorescence signals (C). The results in (C) are not normalized for organ weights and are therefore semi-quantitative comparisons of the controls versus the mice injected with fluorescent NPs. Comparisons were performed via the Welch’s t-test (**p ≤0.01, ***p ≤ 0.001, and **** p ≤ 0.0001).

