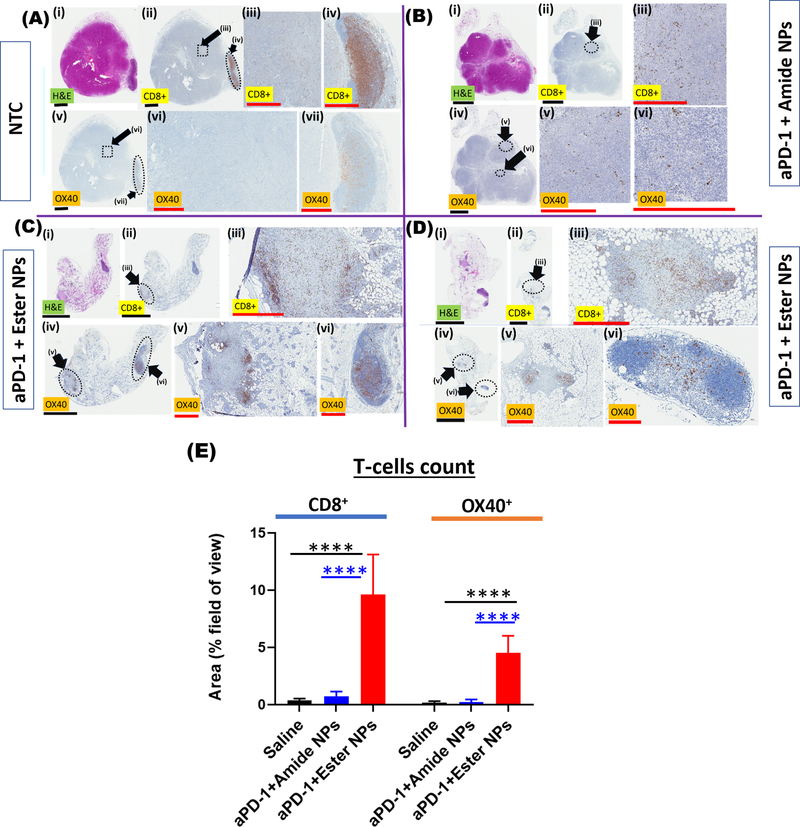
Figure 5.
Histology of hematoxylin and eosin (H&E)-stained tumor tissues (purple-pink), CD8+ T-cell stained tissues (brown spots) and OX40 ligand stained tissues (activated T-cells, brown spots) from mice in the no-treatment (NTC) cohort (A) and the NP-treated cohorts (B-D). Tumors from mice treated with amide NPs + aPD-1 are shown in (B) and those from mice treated with ester NPs + aPD-1 (two mice), are shown in (C-D). In B-D, the faint pink-purple color around the tumors in H&E is dead/dying tumor tissue which appears as faint gray in the CD8+ T-cell and OX40 images. The dotted outlines represent areas that are magnified in the subsequent series of figures illustrated by the roman numerals next to the black arrows. Black scale bars are 3 mm while red scale bars are 0.5 mm. Quantification of the number of immune cells in tumors is shown in (E). Statistical significance in (E) was determined via one-way ANOVA with a Tukey post-test (****p ≤ 0.0001).

