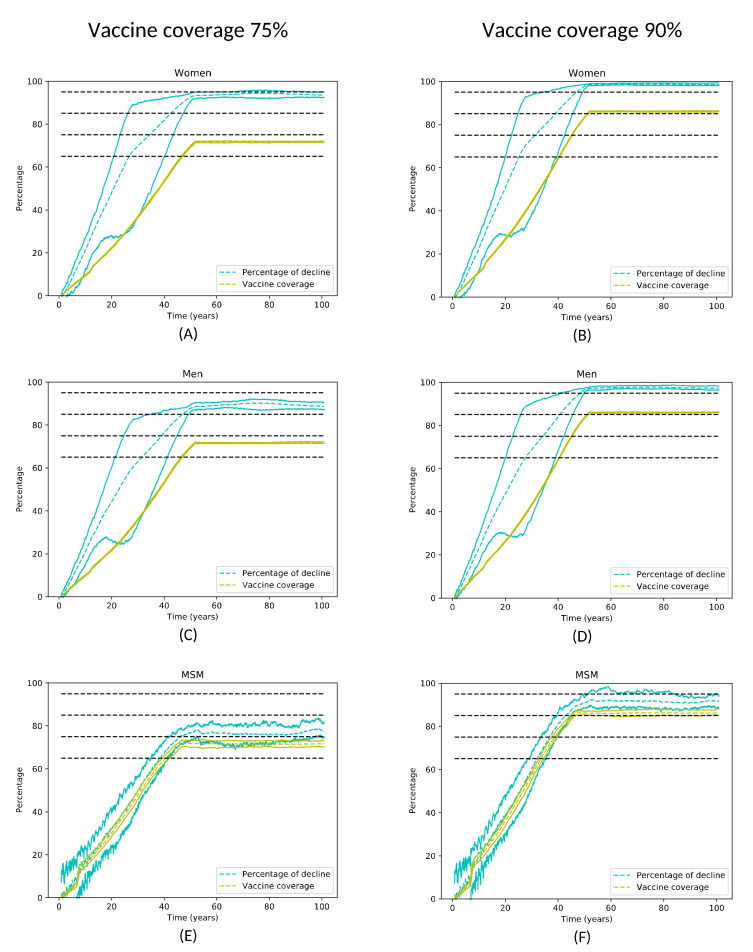
Figure 3.
Decline in the number of infections caused by oncogenic HPV genotypes in women (A,D), men (B,E), and MSM (C,F) aged 14–64 years over the time since the start of vaccination, with 75% (A–C) and 90% (D–F) vaccine coverage. The vaccine coverage in each graph is given by the green curve and the percentage of decline in the incidence of infections is given by the cyan curve with 95% confidence intervals. Time represents the time since the beginning of vaccination in years. Dashed horizontal lines correspond to declines of 65%, 75%, 85%, and 95%.

