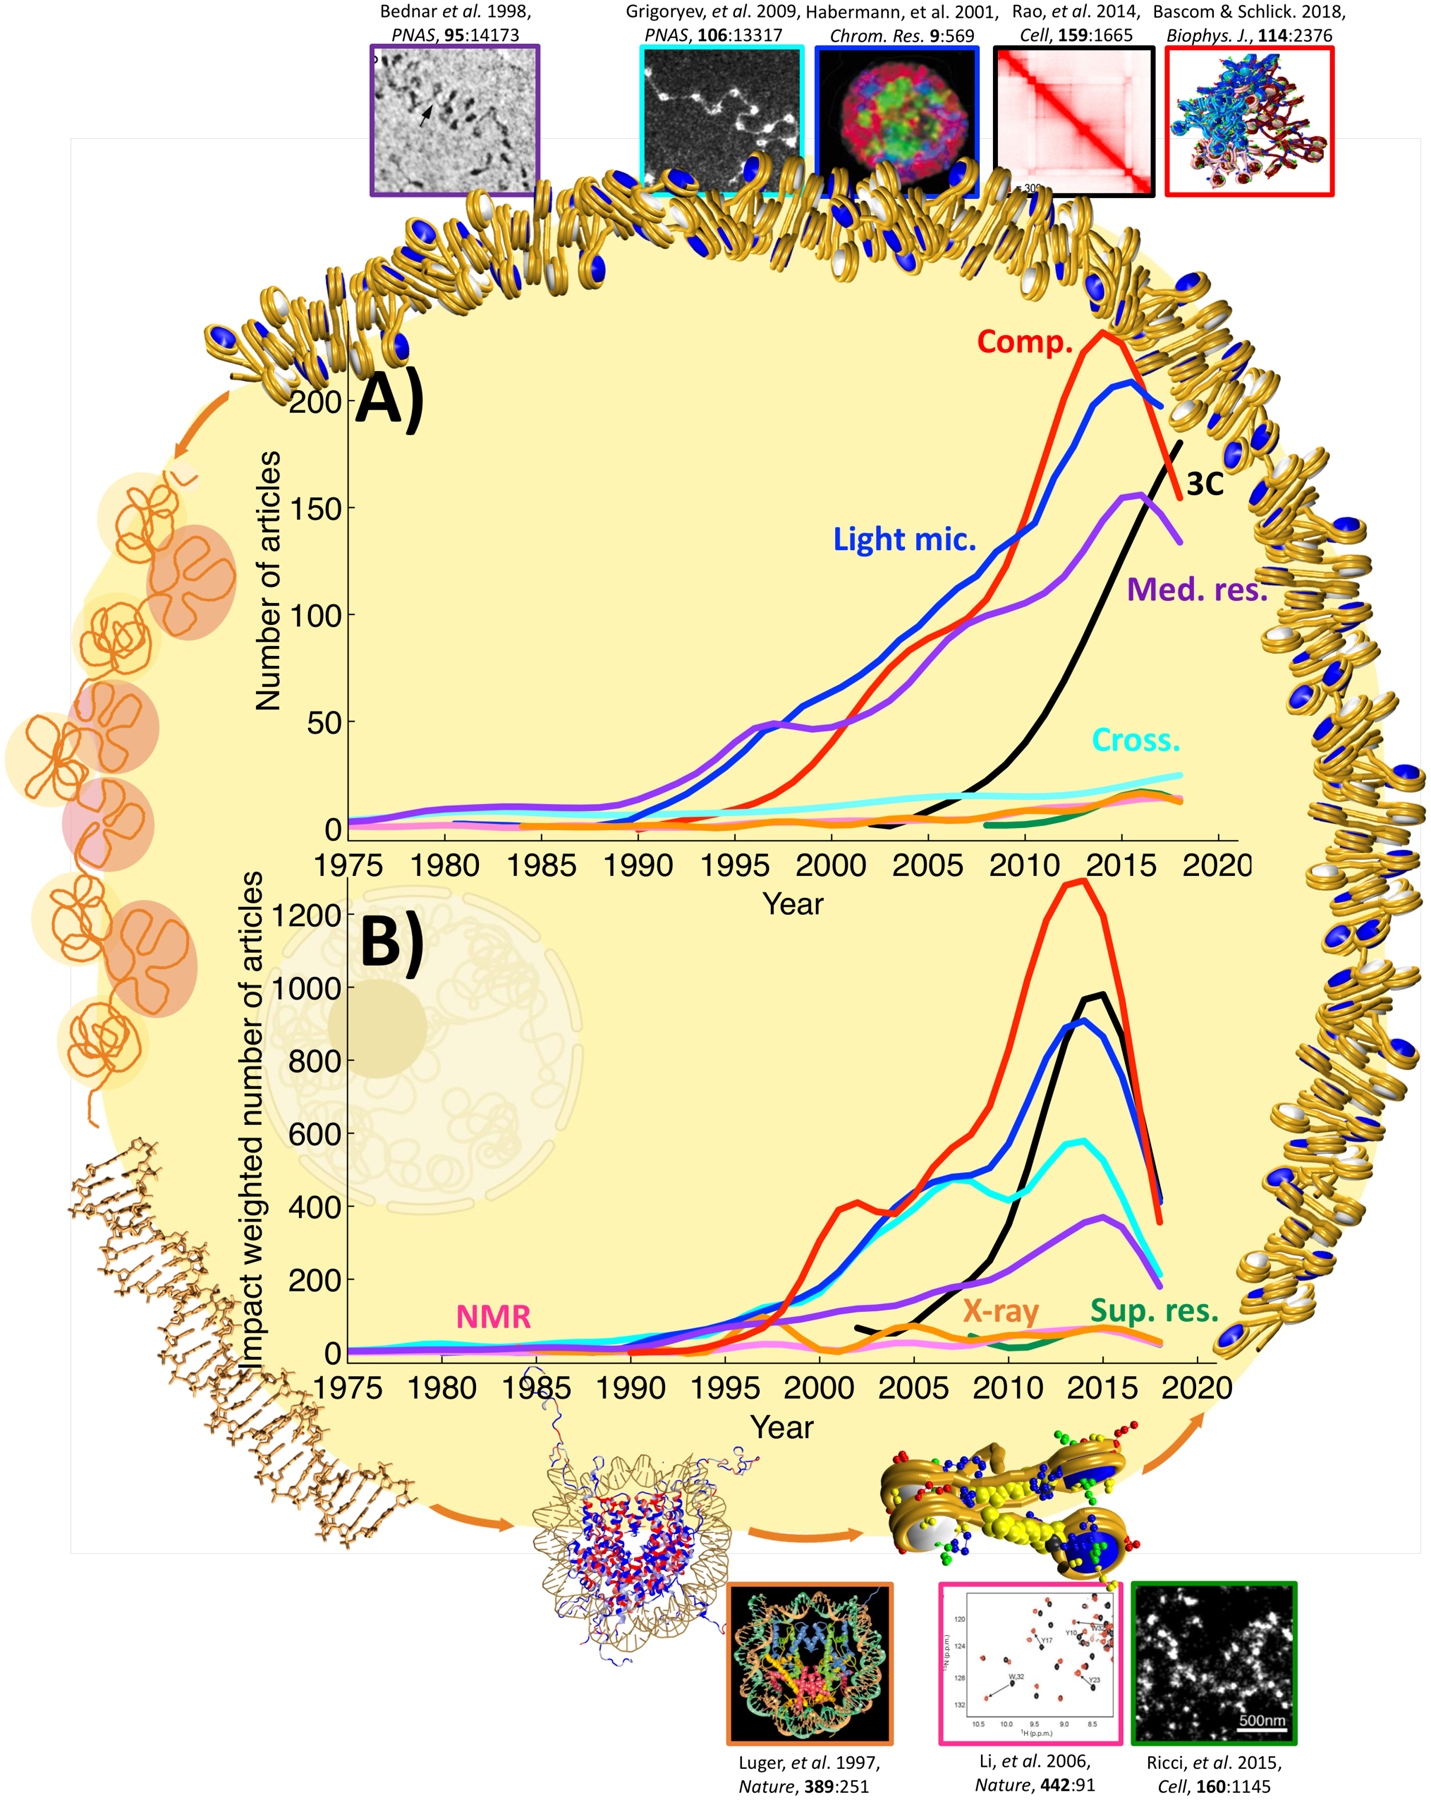
Figure 1.

The impact of various techniques on the study of chromatin structure and function obtained with the Scopus database and a specific combination of keywords for technique and topic, as detailed in Table S1. A) Number of articles per year. B) Impact weighted number of articles; for each article: the total number of citations to date, normalized by number of years since publication. “Comp.” (red curve): computational methods, “Light mic.” (blue): light microscopy techniques, “3C” (black): chromosome conformation capture techniques, “Med. res.” (violet): medium resolution methods, “Cross.” (turquoise): crosslinking techniques, “NMR” (pink): nuclear magnetic resonance techniques, “X-ray” (orange): x-ray crystallography techniques, and “Sup. res.” (green): super-resolution microscopy techniques. Boundary images illustrate chromatin organization levels, from DNA to the nucleosome, nucleosome chains, fibers, and chromosomes. Top and bottom images mark key discoveries obtained by techniques in each category, where the border colors correspond to the technique. Top images, from left to right: Cryo-EM image showing chromatin repeating subunit, adapted with permission from (199); transmission EM image of in situ cross-linked nucleosome chains from metaphase chromatin (70); FISH image showing distribution of chromosome territories in a neuron nucleus, adapted with permission from (200); contact map of 1 Mb segment of human Chr14 at 25 kb resolution, adapted with permission from (191); chromatin fiber of 100 nucleosomes constructed with alternating 25 nucleosomes with acetylated tails and 25 nucleosomes with wild type tails repeated twice, adapted with permission form (97). Bottom images, from left to right: X-ray crystal structure of the nucleosome core particle at 2.8 Å resolution, adapted with permission form (29); 1H,15N NMR spectra showing amide resonances of a transcription factor (BPTF PHD) in the absence (black) and presence (red) of a methylated H3 peptide, adapted with permission form (201); and super-resolution microscopy image of H2B in human fibroblast nucleus showing localization of nucleosomes, adapted with permission from (43).
