
Figure 1.
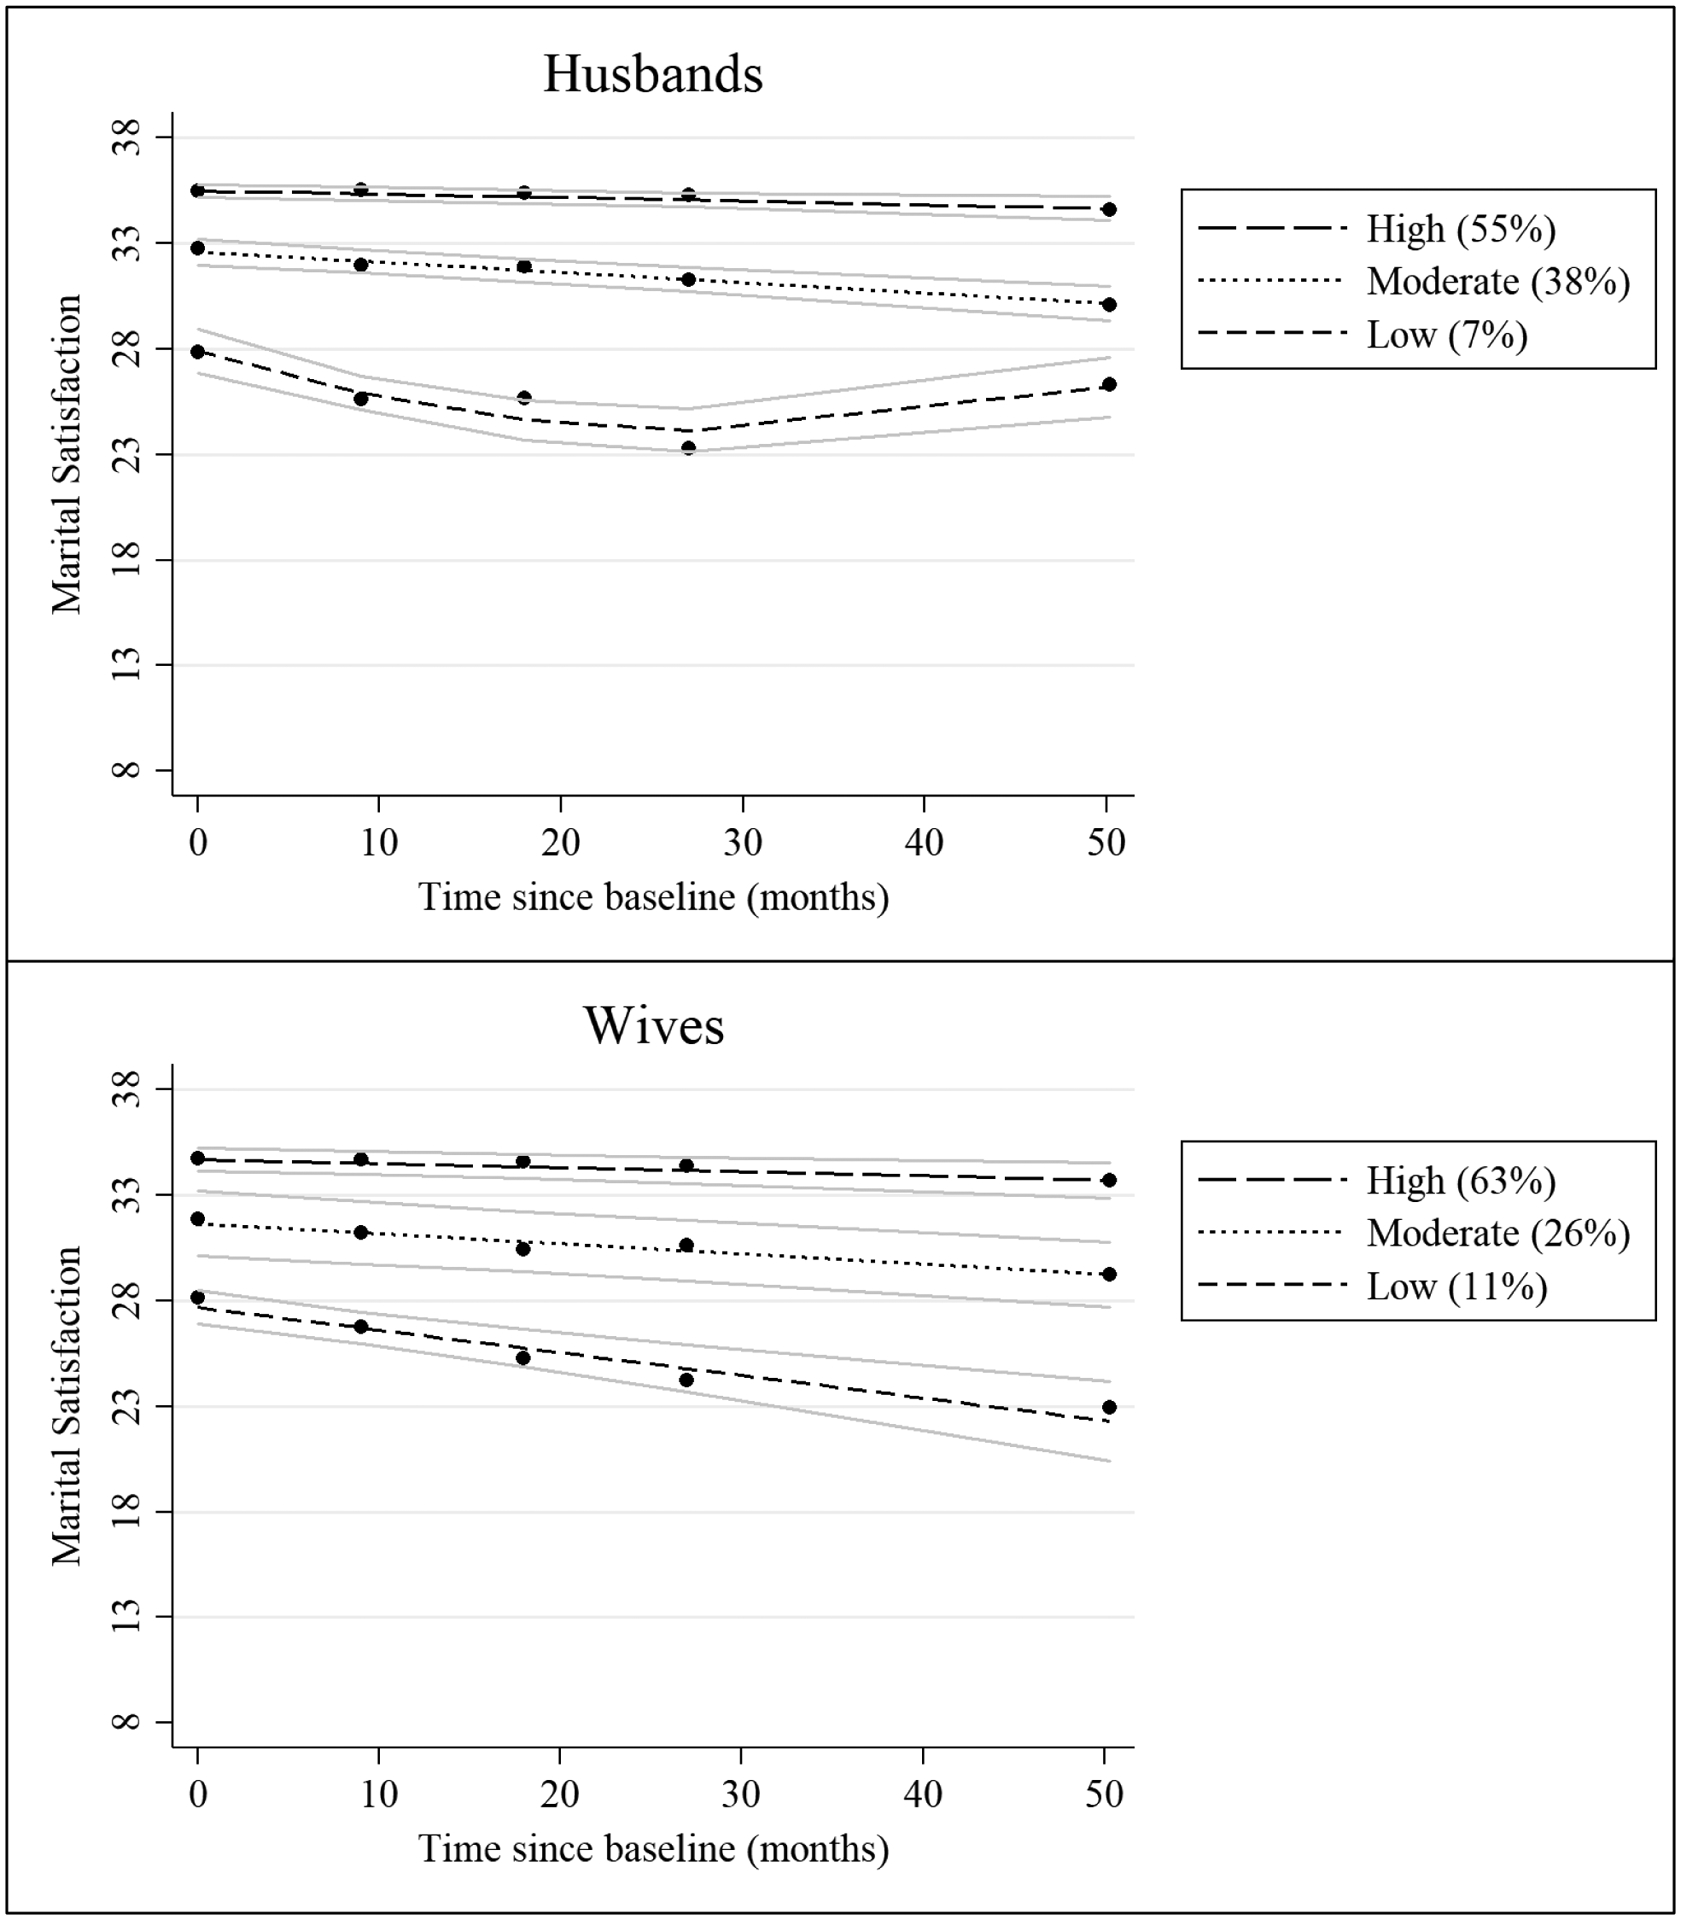
Husbands’ and wives’ marital satisfaction trajectory groups. Observed data are represented by black dots, estimated trajectories are represented by black lines, and 95% confidence intervals around estimated trajectories are represented by gray lines.