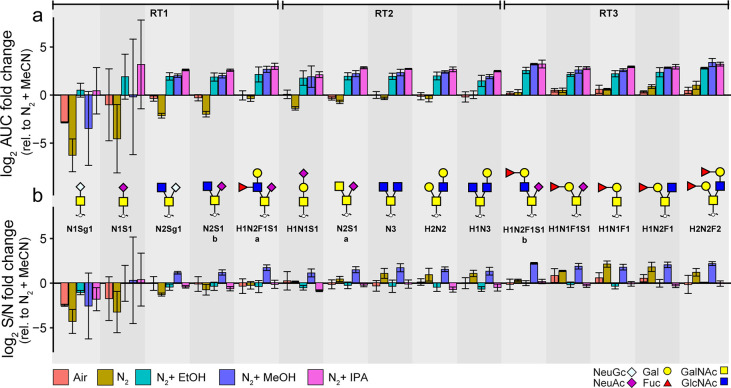
Figure 3.
Effect of different dopant solvents on O-glycans. (A) The fold change of the area under the curve relative to the reference approach (MeCN enriched N2) and (B) fold change of S/N ratios relative to the reference approach (MeCN enriched N2) for the BSM O-glycans (N = 3) in three retention time windows corresponding to different gradient solvent composition RT1:2–10% MeCN, RT2:10–15% MeCN, RT3: 15–26% MeCN. The error bars represent the standard deviation from the mean of the technical replicates (N = 3). The glycans are ordered based upon their elution time. H, hexose; N, N-acetylhexosamine; F, deoxyhexose; S, N-acetylneuraminic acid; Sg, N-glycolylneuraminic acid.

