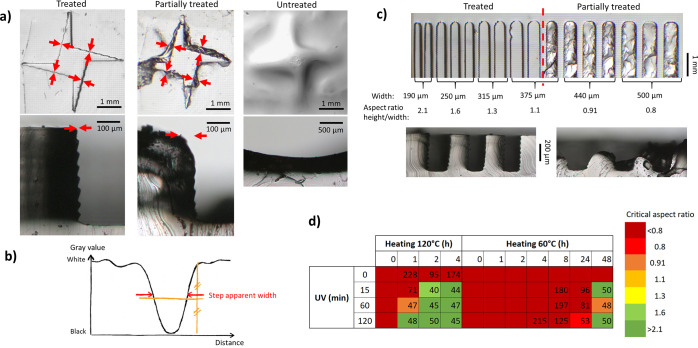
Figure 2.
(a) Microscopy picture of shuriken structures in PDMS for three representative conditions (from left to right; successful, partial replication, and no treatment. Top: top view of PDMS replicates; bottom: cross-sections of PDMS replicates). Red arrows indicate the location of the measurements. (b) Typical gray value profile recorded along the red arrows in (b) to determine the apparent step width. (c) Microscopy pictures of the comb structures in PDMS after successful (left) and partial post-treatment (right), top view (top), and cross-section (bottom). (d) Example of post-treatment screening for FTD industrial red. Numbers correspond to the apparent step width (no value provided in the case of serious PDMS curing inhibition) and the colors to the critical aspect ratio (as detailed in the Experimental Section).

