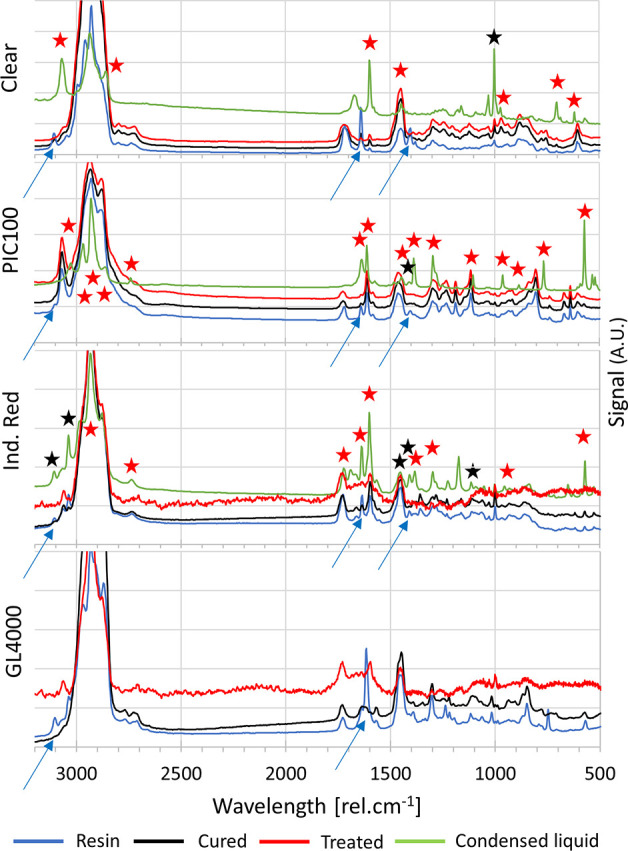
Figure 4.

Raman spectra acquired for four resins (clear, PIC100, Industrial Red and GL4000) before casting (blue), after casting (black), after post-treatment (red), and for the corresponding condensed liquids (green). Arrows indicate bands being attributed to the methacrylate monomers that are not present after polymerization. Stars indicate bands found, respectively, in the BAPO and TPO-L spectra (red), and the methyl methacrylate spectrum (black).
