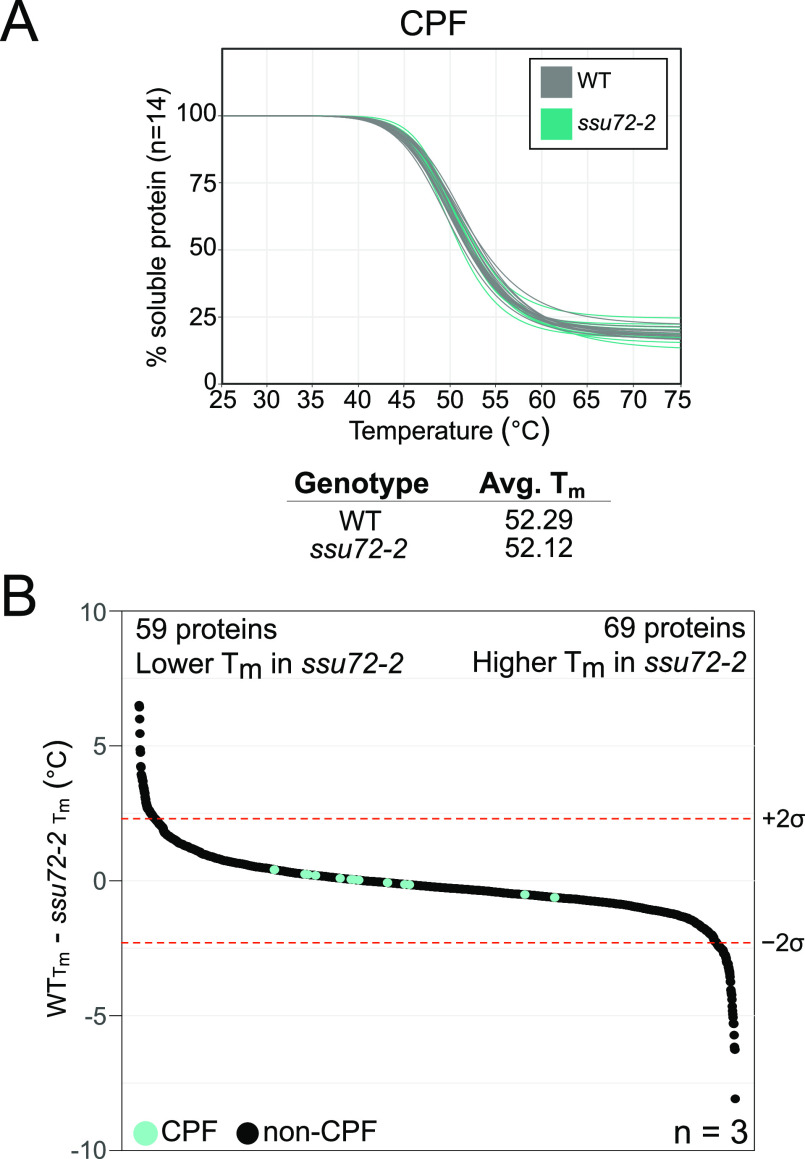
Figure 5.
Effects of ssu72-2 on CPF complex stability and the global proteome. (A) mTPP is normalized CPF subunit melt curves. Plots for each of the CPF subunits are normalized by the TPP package for a representative replicate, trigger p2. The curves shown in gray are WT and turquoise are ssu72-2. Each line represents one of the 14 CPF subunits. Replicates for (A) are provided in Figure S5. (B) Waterfall plots visualizing whole proteome changes in melt temperature (Tm), WT- ssu72-2. Median values are shown for proteins that are quantified in at least two replicates. The dotted lines signify a confidence interval of 95%. There are significant decreases in the thermal stability of 59 proteins and significant increases in 69 proteins. Change in Tm and median values are provided in Table S5.

