
Fig. 3.
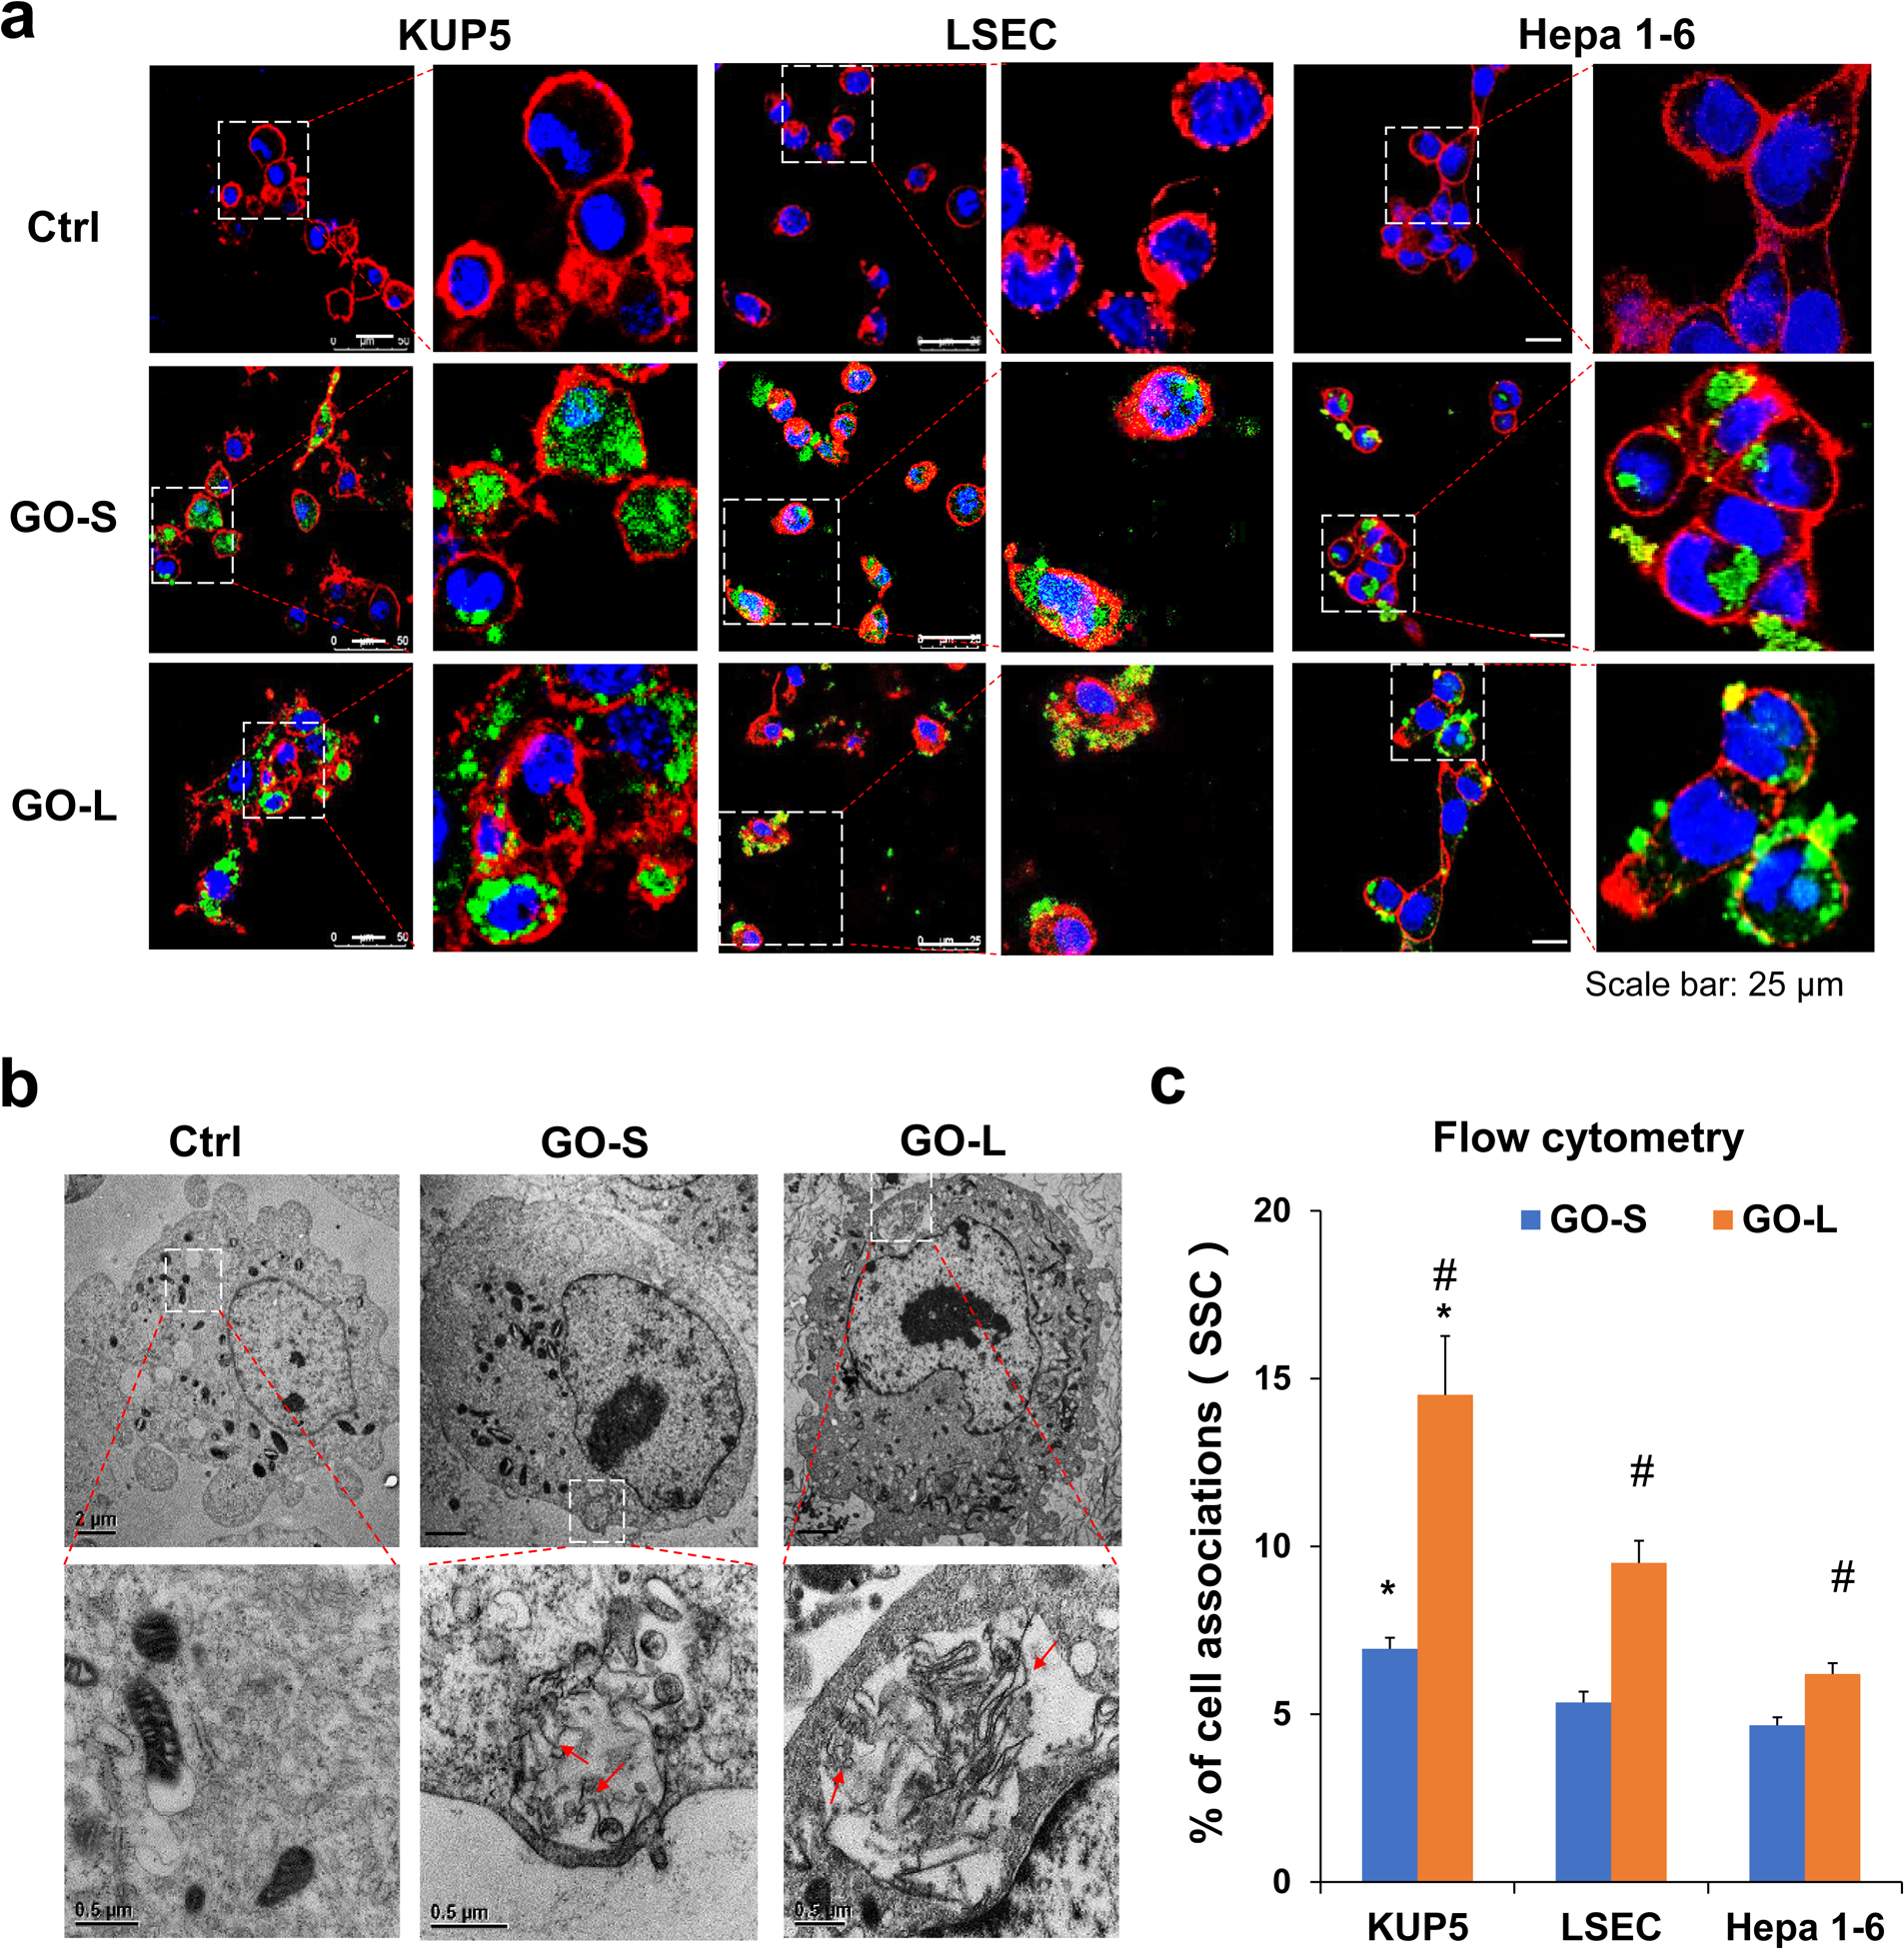
Determination of cellular association of GO in KUP5, LSEC, and Hepa 1–6 cells. (a) Confocal imaging of FITC-BSA-labeled GOs in KUP5, LSEC, and Hepa 1–6 cells. These cells were incubated with 12.5 μg/mL of FITC-labeled GOs (green) for 16 h, followed by staining with Hoechst 33342 dye (blue) and Alexa Fluor 594-labeled WGA antibody (red). The scale bar in the left panel image is 25 μm. (b) Visualizing the interactions of pristine GO with KUP5 cells by TEM. After exposure to 50 μg/mL of GO for 16 h, the cells were washed, fixed, and stained for TEM viewing under a JEOL 1200-EX microscope. Red arrows indicate GO sheets within the phagosomes. Scale bar in the upper panel is 2 μm; Scale bar in the lower panel is 0.5 μm. (c) Quantification for the percentage of SSC values by flow cytometry for GO-treated cells compared to untreated cells. *, P < 0.05, compares KUP5 cells to LSECs or Hepa 1–6 cells; #, P < 0.05, compares GO-L with GO-S.