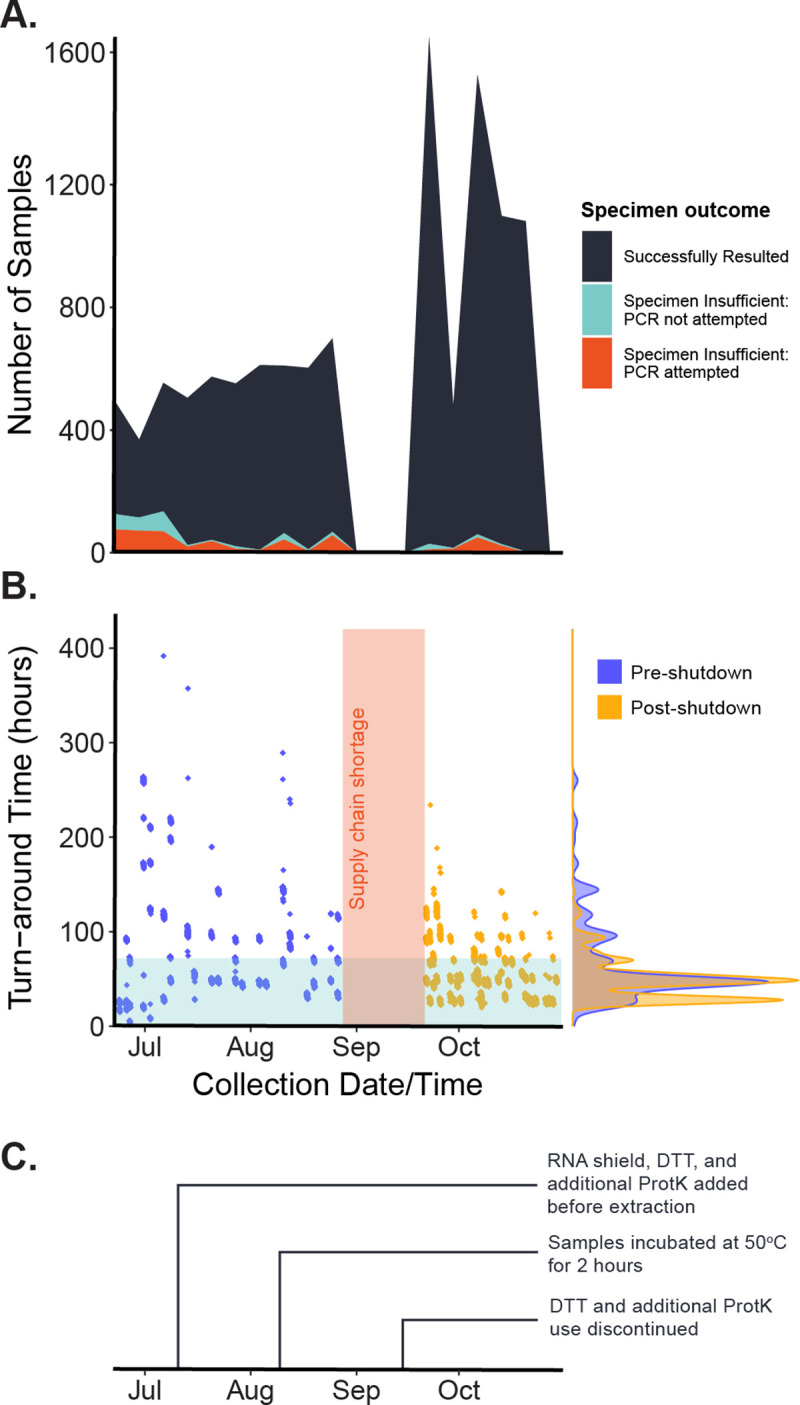
Fig 3. Sample characteristics throughout the study duration.

(A) The proportion of samples (n = 11,971) that returned with a specimen insufficient value decreased throughout the study. The teal-colored band represents samples that were rejected in a step before PCR analysis, such as an inability to pipette. (B) The mean (standard deviation) turn-around time decreased from 72.6 (68.8) hours in the first three weeks (n = 1,417) of the study to 45.9 (19.6) hours in the last three weeks (n = 2,665) of the study. Here, the blue bar depicts a 72-hour turn-around. The vertical red bar depicts the supply-chain shortage period that led to a temporary shutdown in testing. (C) A series of laboratory techniques (see Hamilton et al.) were deployed throughout the study to optimize the protocols, improving the sample rejection rate and turn-around time.
