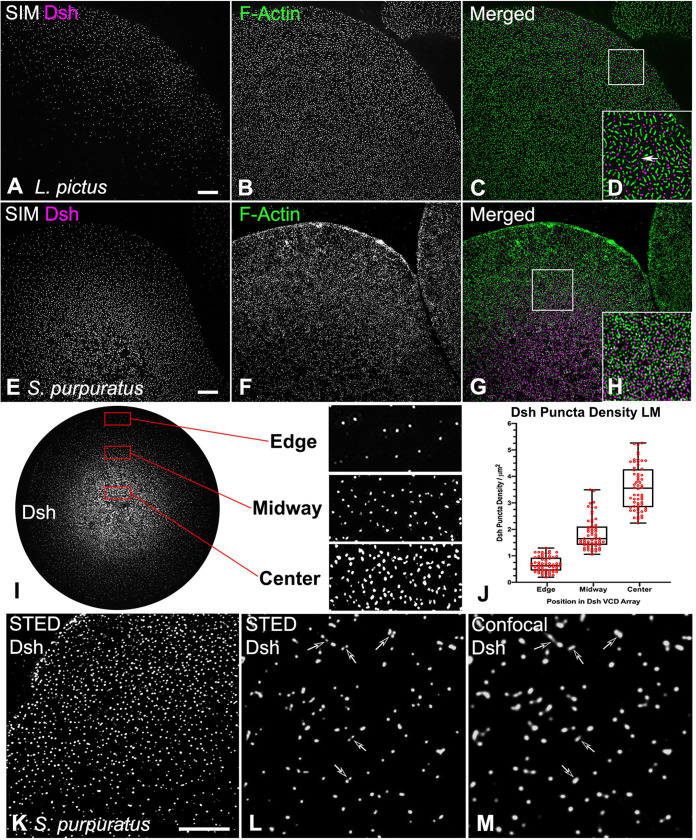
Fig 1. Super-resolution imaging of Dsh and actin staining in the VCD in cortices isolated from unfertilized eggs.
(A-H) 3D-SIM imaging of Dsh (magenta) and F-actin (green) staining of cortices isolated from L. pictus (A-D) and S. purpuratus (E-H) eggs showing the distribution of Dsh puncta relative to microvillar core actin foci. D and H are higher magnification versions of the 10x10 μm white boxes in C and G, and elongate submembranous actin filaments are visible in D (arrow). (I-M) The distribution of Dsh in the VCD appears similar to a diagrammatic representation of a concentration gradient. As shown with the enlarged versions of the 10x5 μm red boxes in I, the lowest density of Dsh puncta are at the VCD edge, with increased density in the midway point, and the maximum density in the center. (J) Quantification of Dsh densities in the three regions of the VCD. The Dsh VCDs of 5 cortices each from three separate experiments were analyzed and the densities in these 3 regions are all statistically significantly different. (K-M) STED imaging of Dsh staining in the S. purpuratus egg VCD reveals that single punctum in confocal images (L, arrows) often appear as multiple spots in the higher resolution STED images (M, arrows). Scale bars = 5 μm.

