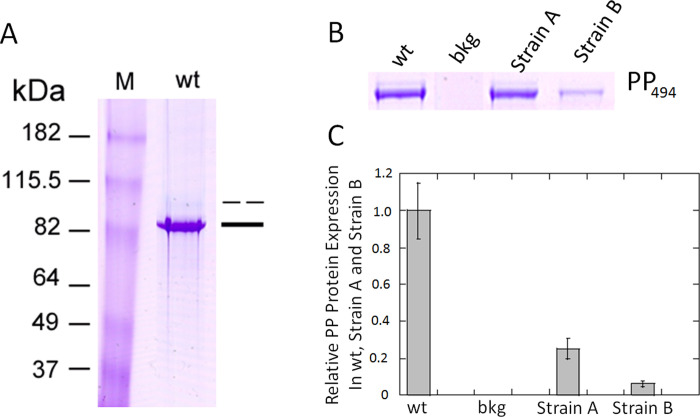
Fig 3. Isolation of DSP and PP from incisor extraction of wt, BAC-DSPP transgene Strain A and Strain B teeth.
(A) Lane 1, wt incisor extraction stained with Stains-All showed two bands. The lower major band stained deep blue around 82 kDa was labeled as PP (single bad). The upper minor band stained light blue was labeled as DSP (broken bar). Antibodies against DSP and PP were used to verify the identity of the incisor extract (see S1, S2 and S3 Figs). (B) Tissues were prepared as described in Methods. The incisor extracts from wt (1:10 dilution), Strain A (1:2.5 dilution), and Strain B (1:2.5 dilution) were run on a PAGE gel and stained with Stains-All. This composite image is derived from S4 Fig. (C) NIH J image bar graph of PP494 protein expression (corrected for dilutions) from Fig 3B. Since Strain A PP band derived from a 2.5x dilution of the incisor extract, showed a similar intensity of PP from 10x dilution of wt incisor extract. Thus, we concluded that wt TCA extract contain four times more PP than that of Strain A. The NIH J image then showed that Strain B contains 1/5 amount of PP compared to that of Strain A with both bands at 2.5x dilution. In summary, Strain A contained 25% of the wt PP494 protein and Stain B contained 5% of the wt PP494 protein.

