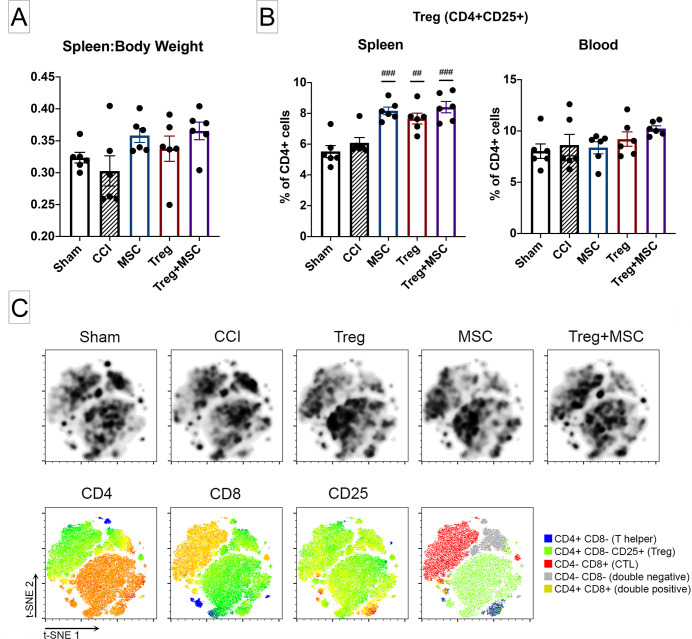
Fig 3. Changes in splenic weight and flow cytometric characterization of immune cells in the spleen and blood after CCI and treatment.
(A): Assessment of changes in the ratio of spleen to body weight at 96 hours after CCI. There were no significant differences between sham and CCI. However, there was a trend towards increased spleen:body weight after Treg+MSC (p = 0.055). (B): Quantification of CD4+CD25+ rat Treg in the spleen and blood after CCI and treatment using flow cytometry logic-based gating. While there were no significant differences Sham and CCI in the spleen or blood, all three treatments increased the percentage of splenic Treg. There were no differences between treatments. (C): t-SNE visualization of change in CD3+ T cell populations in the spleen after CCI and treatment. Density plots (top row) demonstrate distinct differences in cell clusters in the injured and treatment animals (black boxes). Analysis of antibody heat maps (bottom row) show that these boxed clusters are largely CD4+CD25+ cells. N = 6. Statistical significance between sham/treatment and CCI is indicated with (#) for p ≤ 0.05, (##) for p ≤ 0.01, (###) for p ≤ 0.001. Statistical significance between treatment groups is indicated with (*) for p ≤ 0.05, (**) for p ≤ 0.01, (***) for p ≤ 0.001. CCI, controlled cortical impact; Treg, regulatory T cell; t-SNE, t-distributed stochastic neighbor embedding.

