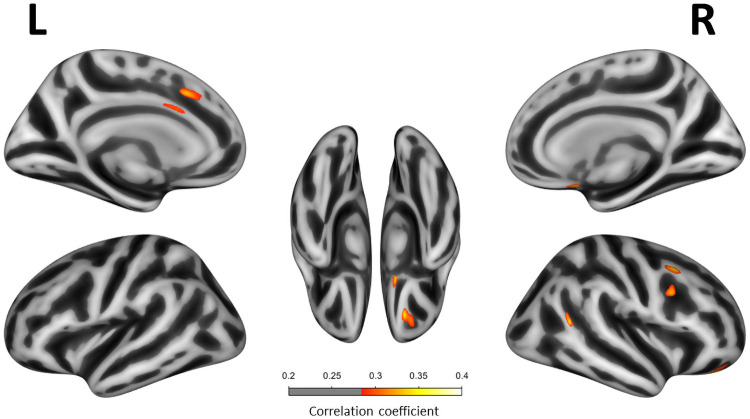
Fig 2. Correlation between Insomnia Severity Index scores and cortical thickness.
Correlation between ISI scores and cortical thickness in all participants (n = 120). Only regions with P-value < .001 (uncorrected FWE) are shown. All multivariate linear regression models were adjusted for age, sex, handiness and scan type. Correlation coefficients are expressed as a color scale, indicating an increasing strength of the correlation from red to yellow.

