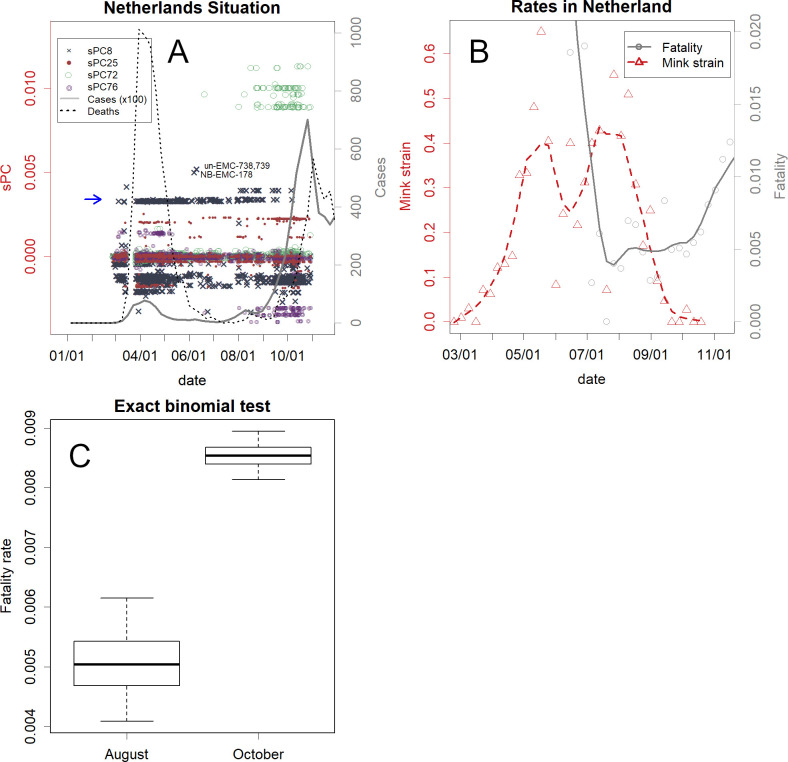
Fig 2. The SARS-CoV-2 outbreak in the Netherlands.
A. Number of confirmed cases, deaths, and PC for human-virus. Before the second wave, variants had changed (coloured points of specified axes of PCs). The mink-derived human-virus appeared at and above the level of PC8 (x) indicated by the blue arrow. B. Rates of fatality (number of deaths in the following week/cases, grey) and the mink-derived variants (red). C. Comparison of fatality rates in August and October. The thick horizontal line indicates the estimation of the rate. The whiskers show 95% confidence intervals, and the boxes show the quartiles. The situation in Denmark is presented in S1 Fig.

