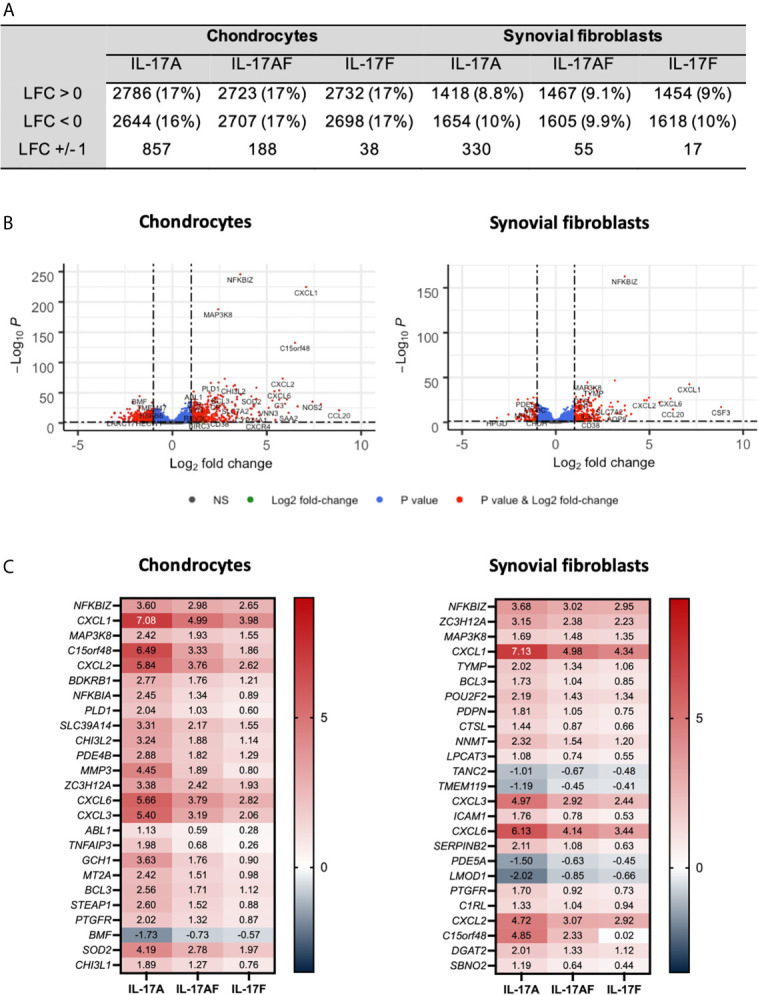
Figure 2.

Changes in gene expression after treatment with IL-17A, IL-17AF, or IL-17F compared to vehicle control measured by bulk RNA-Seq. (A) Overview of changes induced by IL-17 cytokines (padj<0.05). (B) Volcano plots showing the changes in gene expression after treatment with IL-17A in chondrocytes (left) and synovial fibroblasts (right). Grey = not significant (NS); green = Log2 fold change of at least 1 or -1, but p>0.05; blue = p-value < 0.05, but log2 fold change >-1 and <1; red = p-value<0.05 and log2 fold change of at least -1 or +1. (C) Heatmap of the 25 most significantly differentially expressed genes by chondrocytes (left) and synovial fibroblasts (right). Red = upregulated, blue = downregulated. n=6.
