
Figure 4.
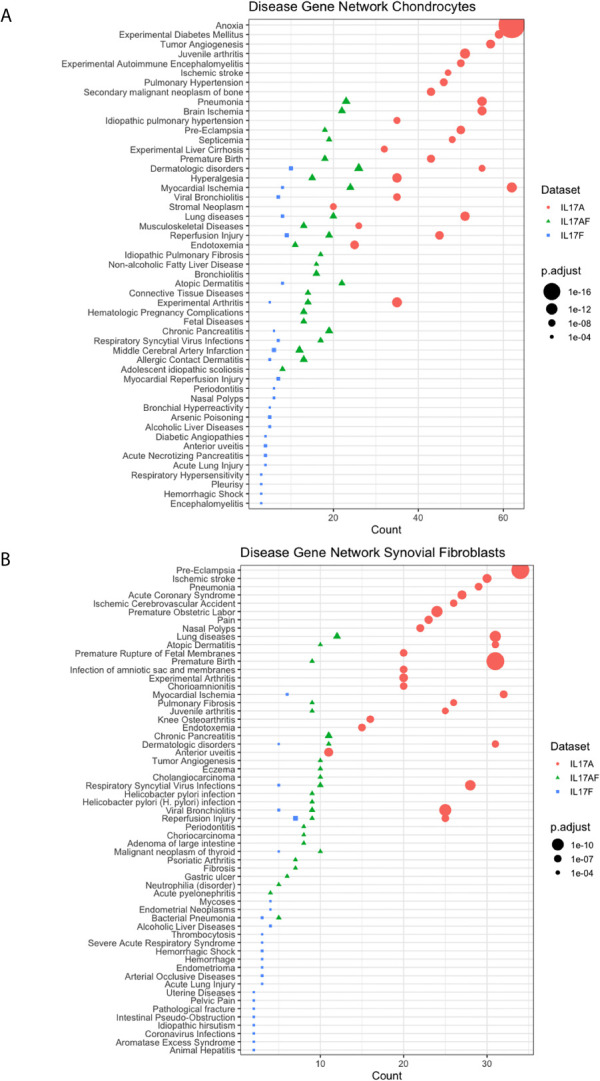
Results from Disease-Gene Network (DiGeNeT) in (A) chondrocytes and (B) synovial fibroblasts. Dotplots displaying 25 most significantly associated disease gene sets with the differently expressed genes (DEGs) (padj<0.05, LFC ± 1) after treatment with IL-17A (coral), IL-17AF (green), and IL-17F (blue), including gene count (number of DEG in each disease geneset) and the adjusted p-value.